Donate
New Democracy Maps

LGBT Populations

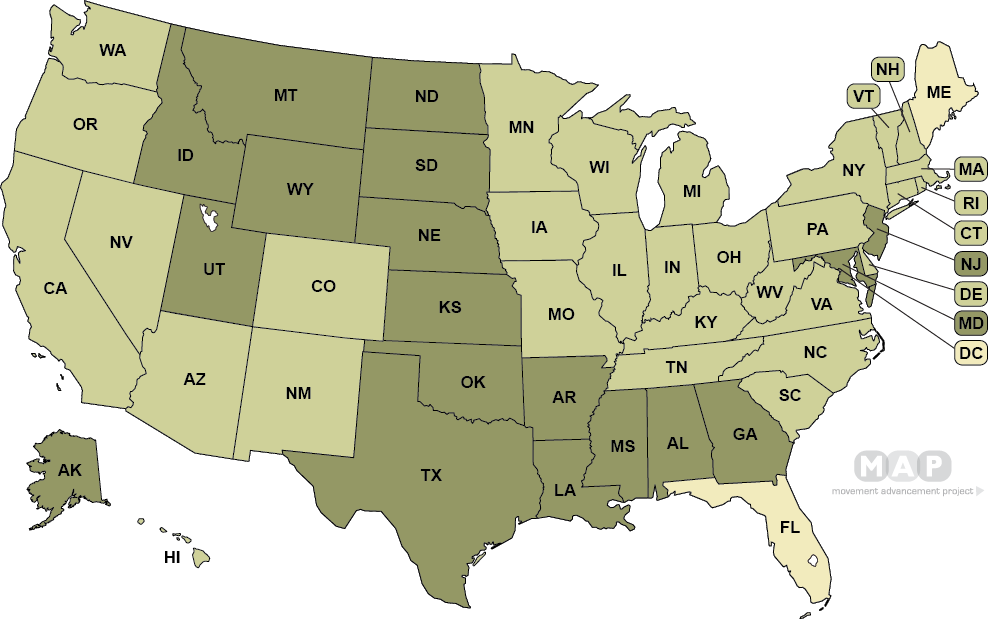
This map shows the estimated raw number of LGBT people (ages 13+) living in each state. The data are based on a Williams Institute analysis of surveys conducted by Gallup Polling (2012-2017) and the Centers for Disease Control and Prevention (CDC; 2015 and 2017 YRBS). For more information, see the methodology in the Williams analysis. 
United States Map
Washington New York U.S. Virgin Islands Puerto Rico Guam Commonwealth of the Northern Mariana Islands American Samoa New Hampshire Vermont Virginia Pennsylvania New York Maine West Virginia Ohio Kentucky Indiana Michigan Illinois Wisconsin North Carolina South Carolina Tennessee Georgia Florida Mississippi Missouri Arkansas Louisiana Iowa Minnesota Oklahoma Kansas Nebraska South Dakota North Dakota Texas 33 Colorado Wyoming Montana Idaho Arizona Utah Nevada Oregon California Hawaii Alaska Massachusetts Rhode Island Connecticut New Jersey Delaware Maryland Washington D.C. New Hampshire Vermont
  • 500K - 1.4M+
  • 200K - 499K
  • 50K - 199K
  • 8K - 49K
Data are not currently available about LGBT people living in the U.S. territories.

Percent of Adult LGBTQ Population Covered by Laws

*Note: These percentages reflect estimates of the LGBTQ adult population living in the 50 states and the District of Columbia. Estimates of the LGBTQ adult population in the five inhabited U.S. territories are not available, and so cannot be reflected here.

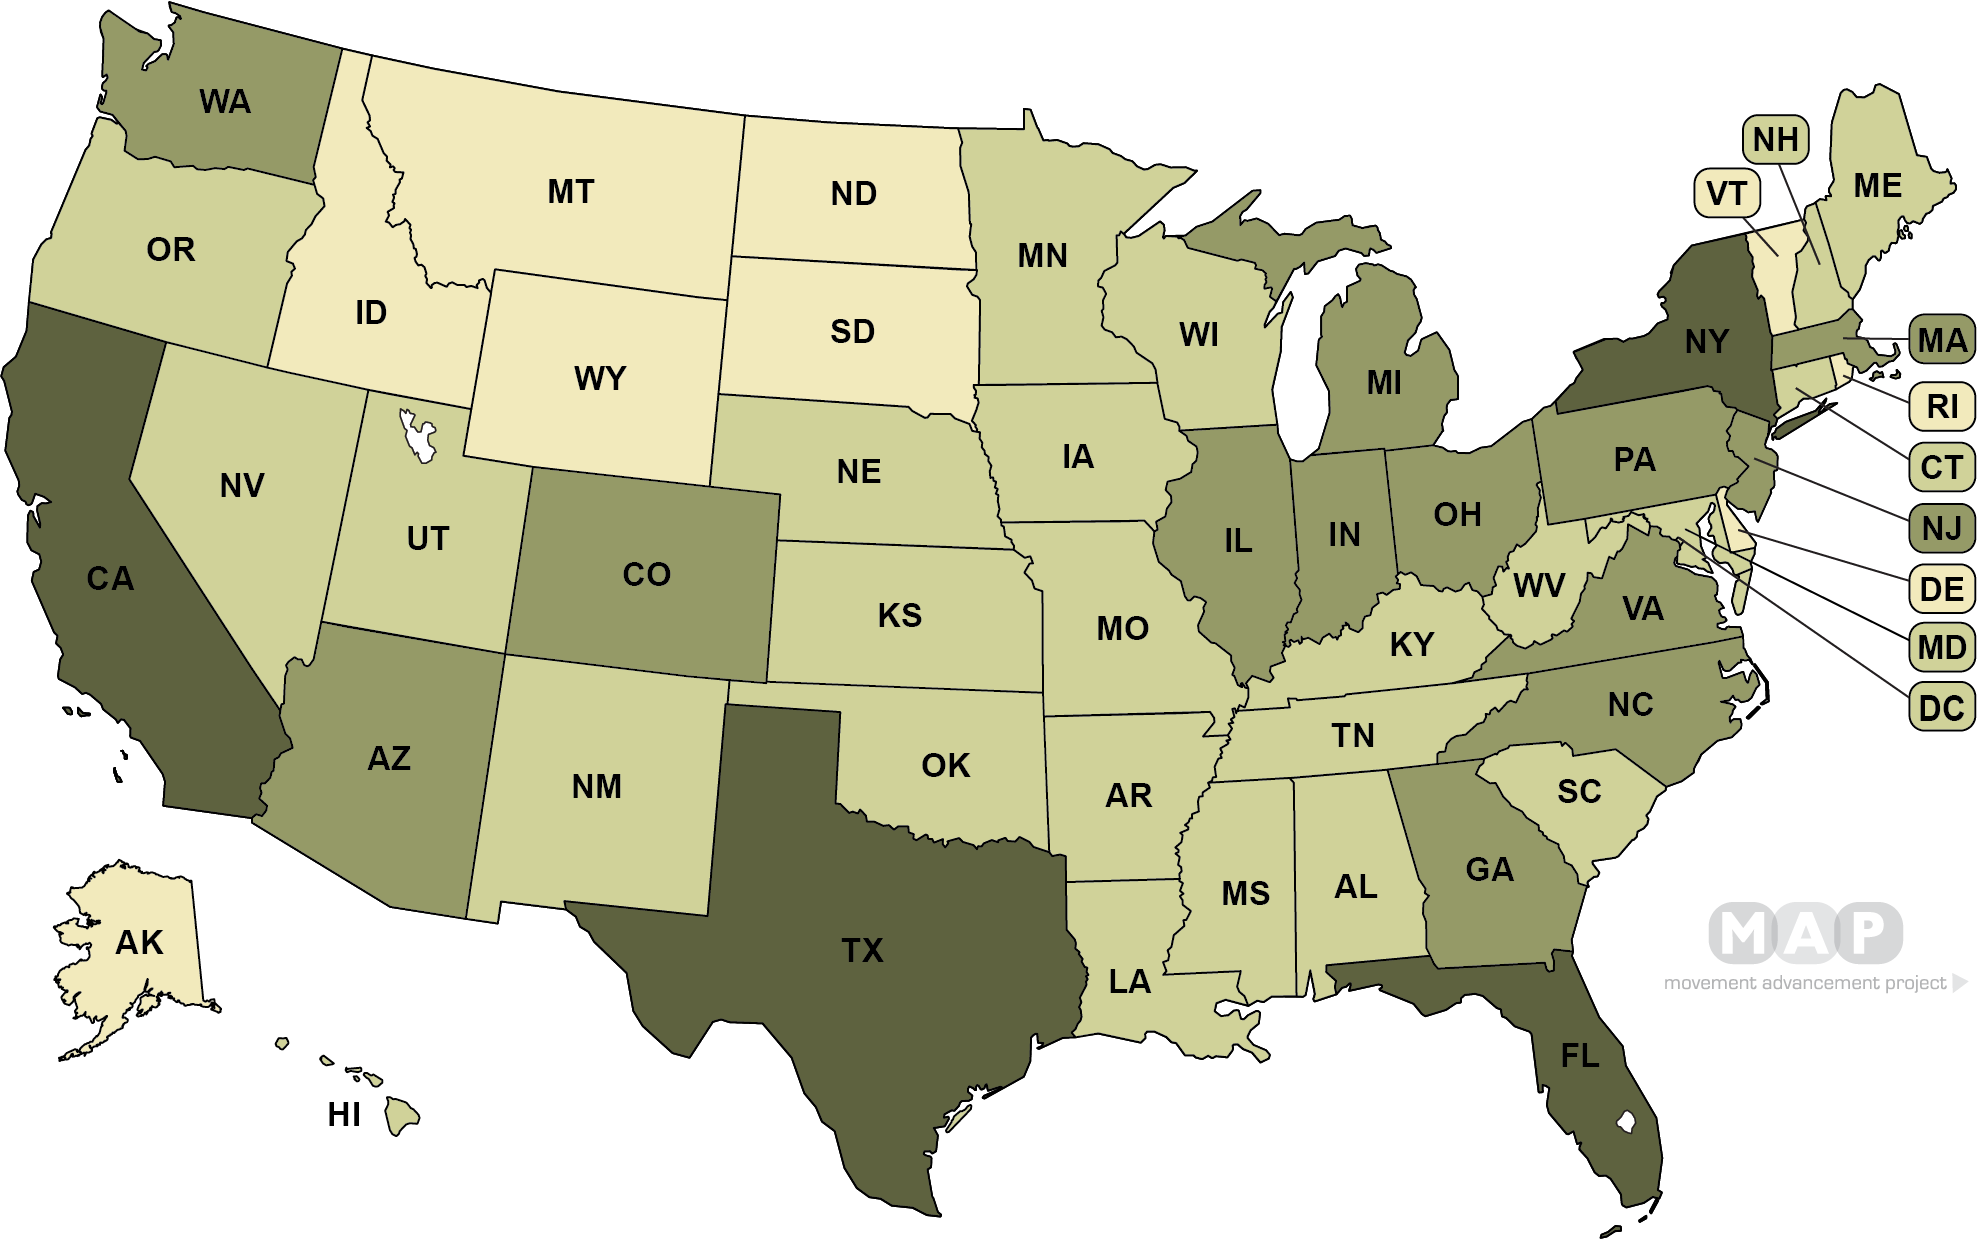
This map shows the estimated percentage of each state's adult (ages 18+) population that identifies as lesbian, gay, bisexual, or transgender, based on a 2018 analysis of Gallup data by The Williams Institute.
United States Map
  • 5.0% and greater
  • 4.0%-4.9%
  • 3.0%-3.9%
  • 1.5%-2.9%

Percent of Adult LGBTQ Population Covered by Laws

*Note: These percentages reflect estimates of the LGBTQ adult population living in the 50 states and the District of Columbia. Estimates of the LGBTQ adult population in the five inhabited U.S. territories are not available, and so cannot be reflected here.
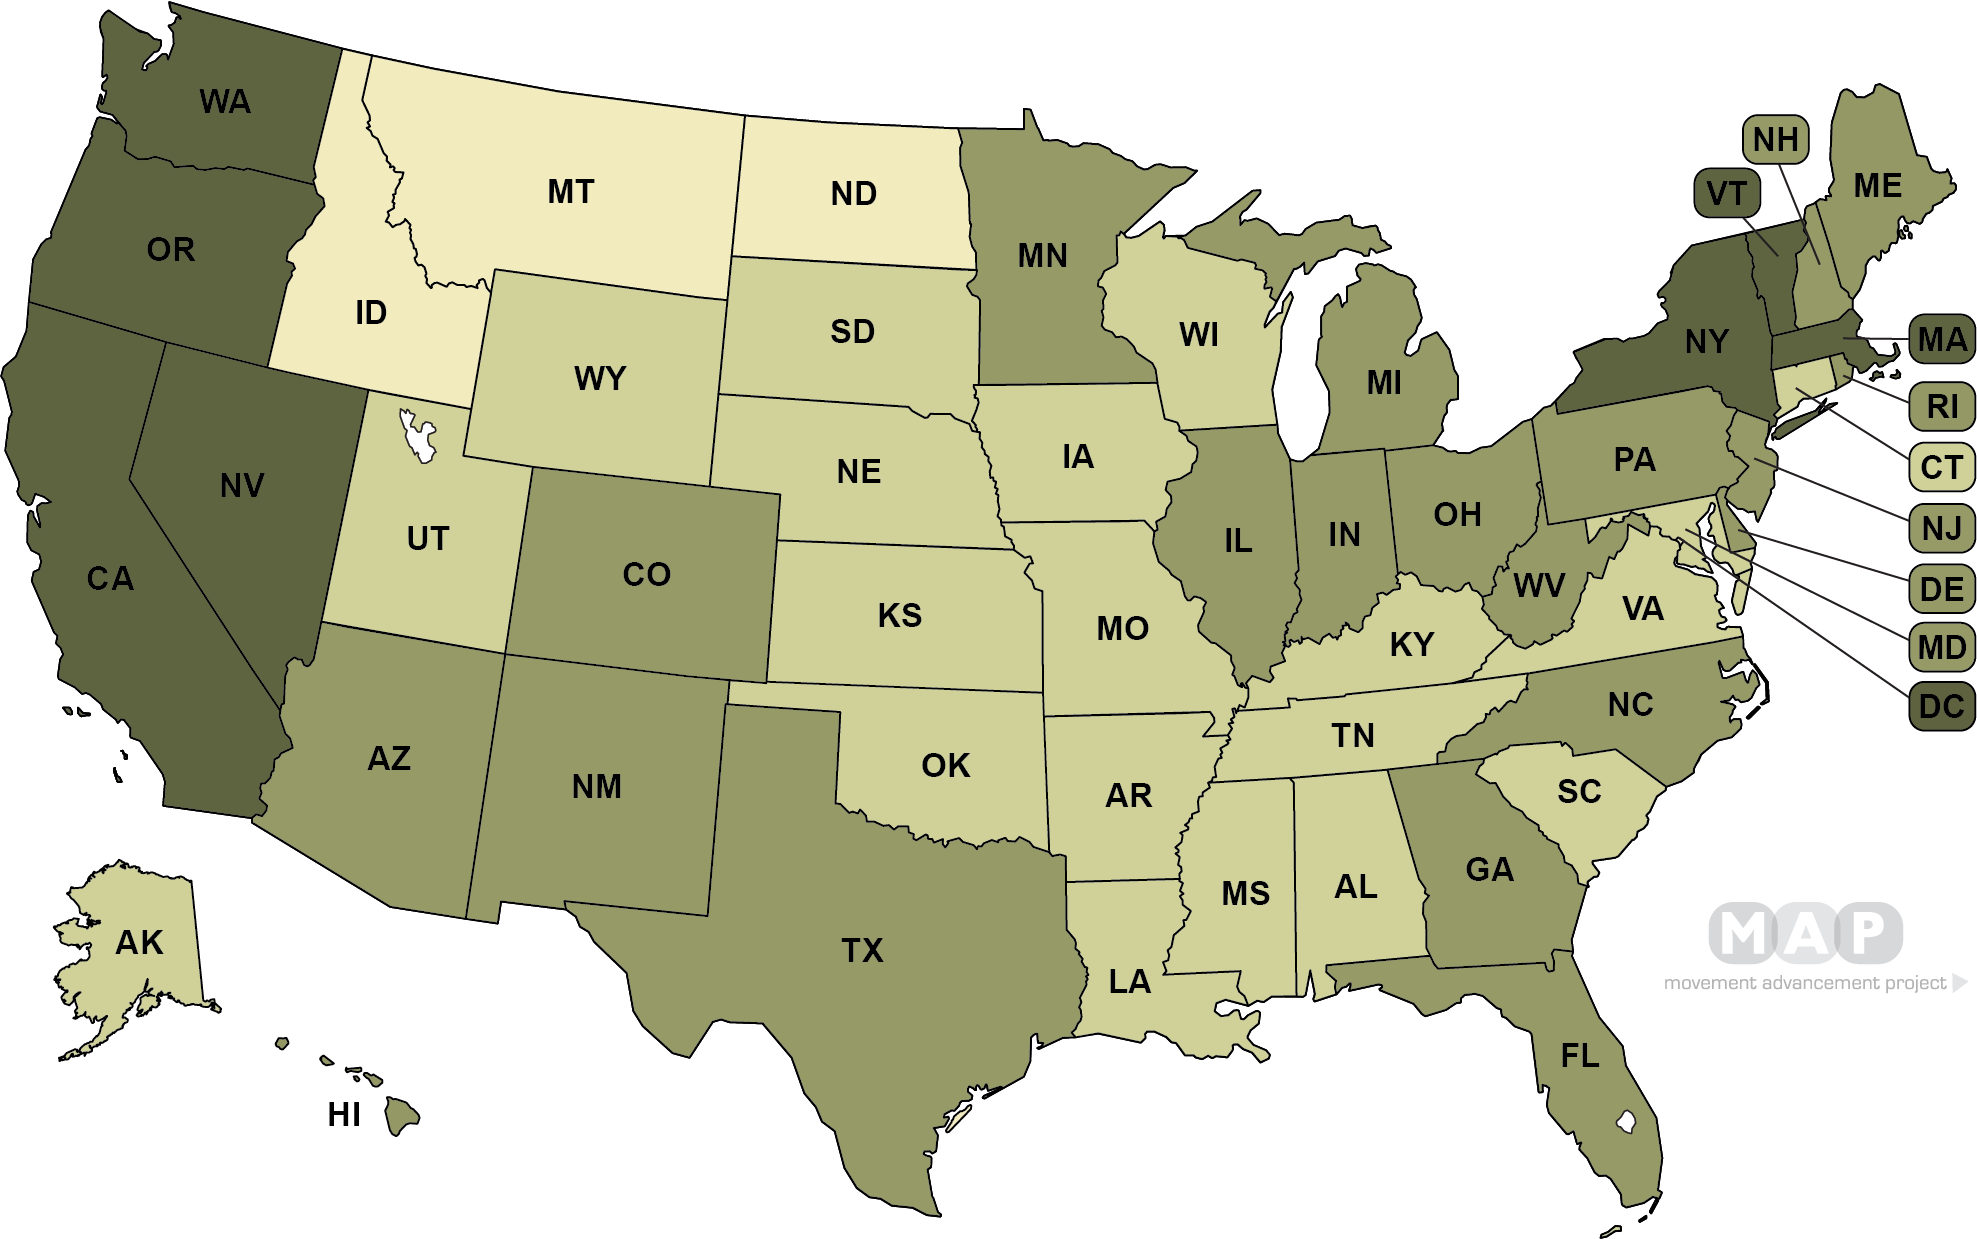
This map shows the percent of LGBT people (ages 25 and over) raising children in each state, based on data collected by Gallup and analyzed by the The Williams Institute. Data for the five U.S. territories are not available. For more information, contact The Williams Institute.
United States Map
  • 40%+ LGBTQ Individuals raising children(2 states)
  • 30 - 39.9% LGBTQ individuals raising children (13 states)
  • 20 - 29.9% LGBTQ individuals raising children (32 states)
  • Under 15% LGBTQ population raising children (3 states , 5 territories + D.C.)
*Data for the five U.S. territories are not available. For more information, contact the Williams Institute.

Percent of Adult LGBTQ Population Covered by Laws

*Note: These percentages reflect estimates of the LGBTQ adult population living in the 50 states and the District of Columbia. Estimates of the LGBTQ adult population in the five inhabited U.S. territories are not available, and so cannot be reflected here.
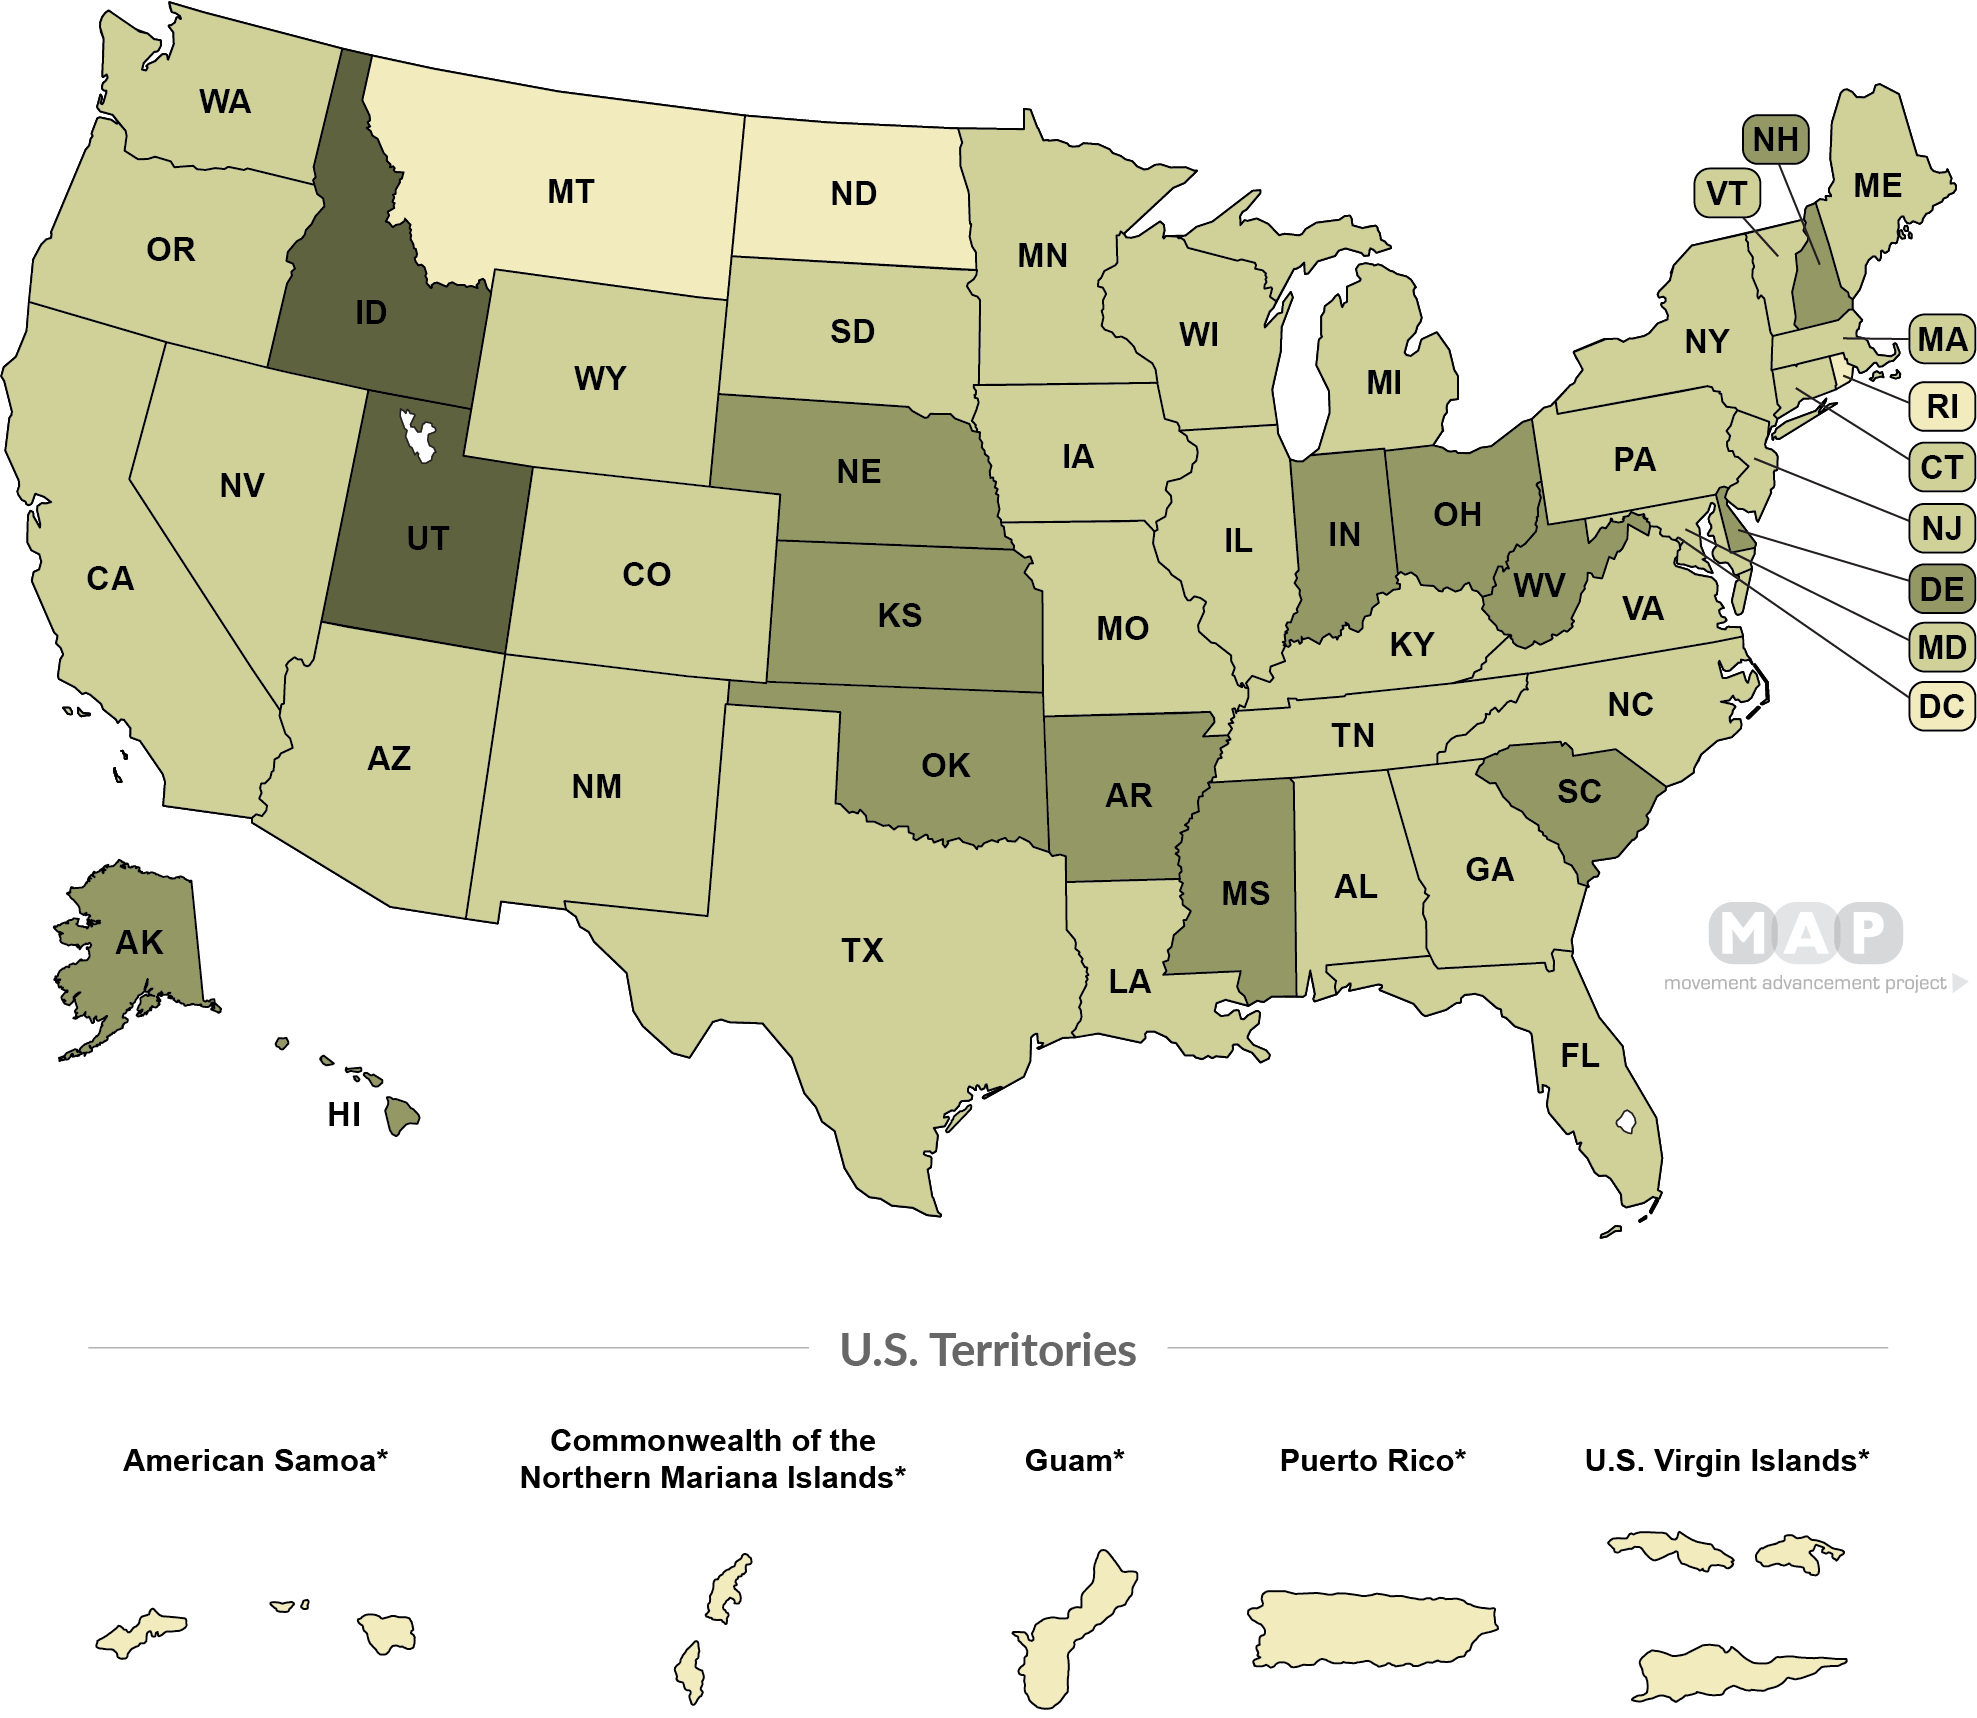
This map shows the percent of same-sex couples raising children in each state, based on data collected by the 2010 U.S. Census and analyzed by the The Williams Institute. For more information, contact The Williams Institute.
United States Map
  • 20%+ population same-sex couples raising children(13 states)
  • 15% - 19.9% population same-sex couples raising children (35 states)
  • Under 15% population same-sex couples raising children (2 states , 5 territories + D.C.)

Percent of Adult LGBTQ Population Covered by Laws

*Note: These percentages reflect estimates of the LGBTQ adult population living in the 50 states and the District of Columbia. Estimates of the LGBTQ adult population in the five inhabited U.S. territories are not available, and so cannot be reflected here.
State Total Adult Population LGBT Adult Population LGBT Population Density % of LGBTQ Individuals Raising Children % of Same-Sex Couples Raising Children
Alabama 4,887,871 147,000 3.1% 24.0% 20.4%
Alaska 737,438 25,000 3.7% 34.0% 23.1%
American Samoa 55,519 N/A N/A N/A N/A
Arizona 7,171,646 286,000 4.5% 25.0% 16.5%
Arkansas 3,013,825 95,000 3.3% 36.0% 21.2%
California 39,557,045 1,859,000 5.3% 24.0% 16.0%
Colorado 5,695,564 234,000 4.6% 25.0% 15.9%
Connecticut 3,572,665 133,000 3.9% 20.0% 17.0%
Delaware 967,171 40,000 4.5% 35.0% 15.6%
District of Columbia 702,455 58,000 9.8% 9.0% 8.7%
Florida 21,299,325 886,000 4.6% 24.0% 13.3%
Georgia 10,519,475 425,000 4.5% 27.0% 19.6%
Guam 159,358 N/A N/A N/A N/A
Hawaii 1,420,491 59,000 4.6% 30.0% 15.8%
Idaho 1,754,208 48,000 2.8% 44.0% 22.3%
Illinois 12,741,080 506,000 4.3% 28.0% 16.6%
Indiana 6,691,878 272,000 4.5% 34.0% 18.9%
Iowa 3,156,145 106,000 3.6% 27.0% 18.6%
Kansas 2,911,505 92,000 3.3% 33.0% 21.8%
Kentucky 4,468,402 144,000 3.4% 26.0% 18.5%
Louisiana 4,659,978 169,000 3.9% 28.0% 19.9%
Maine 1,338,404 60,000 4.9% 21.0% 13.8%
Maryland 6,042,718 234,000 4.2% 20.0% 20.3%
Massachusetts 6,902,149 335,000 5.4% 21.0% 17.1%
Michigan 9,995,915 373,000 4.0% 27.0% 18.2%
Minnesota 5,611,179 210,000 4.1% 28.0% 16.5%
Mississippi 2,986,530 99,000 3.5% 34.0% 25.7%
Missouri 6,126,452 217,000 3.8% 26.0% 17.3%
Montana 1,062,305 30,000 2.9% 19.0% 22.0%
Nebraska 1,929,268 67,000 3.8% 32.0% 19.6%
Nevada 3,034,392 145,000 5.5% 22.0% 17.0%
New Hampshire 1,356,458 59,000 4.7% 31.0% 16.5%
New Jersey 8,908,520 343,000 4.1% 25.0% 19.7%
New Mexico 2,095,428 85,000 4.5% 29.0% 17.8%
New York 19,542,209 913,000 5.1% 22.0% 16.4%
North Carolina 10,383,620 382,000 4.0% 26.0% 18.5%
North Dakota 760,077 20,000 2.7% 10.0% 21.6%
Northern Mariana Islands 53,833 N/A N/A N/A N/A
Ohio 11,689,442 462,000 4.3% 30.0% 17.7%
Oklahoma 3,943,079 138,000 3.8% 38.0% 20.9%
Oregon 4,190,713 207,000 5.6% 23.0% 16.3%
Pennsylvania 12,807,060 490,000 4.1% 27.0% 15.9%
Puerto Rico 3,195,153 N/A N/A N/A N/A
Rhode Island 1,057,315 44,000 4.5% 19.0% 15.5%
South Carolina 5,084,127 167,000 3.5% 30.0% 18.9%
South Dakota 882,235 25,000 3.0% 29.0% 21.1%
Tennessee 6,770,010 223,000 3.5% 29.0% 18.1%
Texas 28,701,845 1,053,000 4.1% 29.0% 19.8%
U.S. Virgin Islands 106,405 N/A N/A N/A N/A
Utah 3,161,108 104,000 3.7% 40.0% 20.1%
Vermont 626,299 30,000 5.2% 23.0% 18.6%
Virginia 8,517,685 308,000 3.9% 26.0% 16.0%
Washington 7,535,591 342,000 5.2% 28.0% 15.8%
West Virginia 1,805,832 68,000 4.0% 31.0% 17.8%
Wisconsin 5,813,568 207,000 3.8% 29.0% 16.4%
Wyoming 577,737 18,000 3.3% 28.0% 24.7%
Data current as of 01/25/2025
This map is powered by

Stay Informed

Be the first to know about new reports and MAP news by signing up for our newsletter


Request User Access

A limited set of materials is restricted to the staff and board members of LGBTQ movement organizations. Click below to request user access.

Join MAP

View our privacy policy.

Sexual Orientation Policy Tally

The term “sexual orientation” is loosely defined as a person’s pattern of romantic or sexual attraction to people of the opposite sex or gender, the same sex or gender, or more than one sex or gender. Laws that explicitly mention sexual orientation primarily protect or harm lesbian, gay, and bisexual people. That said, transgender people who are lesbian, gay or bisexual can be affected by laws that explicitly mention sexual orientation.

Gender Identity Policy Tally

“Gender identity” is a person’s deeply-felt inner sense of being male, female, or something else or in-between. “Gender expression” refers to a person’s characteristics and behaviors such as appearance, dress, mannerisms and speech patterns that can be described as masculine, feminine, or something else. Gender identity and expression are independent of sexual orientation, and transgender people may identify as heterosexual, lesbian, gay or bisexual. Laws that explicitly mention “gender identity” or “gender identity and expression” primarily protect or harm transgender people. These laws also can apply to people who are not transgender, but whose sense of gender or manner of dress does not adhere to gender stereotypes.

Choose an Issue

Choose an Issue