MAP relied on research and data from the MIT Election Data + Science Lab’s
Election Performance Index for this map and the information below. Please note the most current data is drawn from the 2020 election.
-
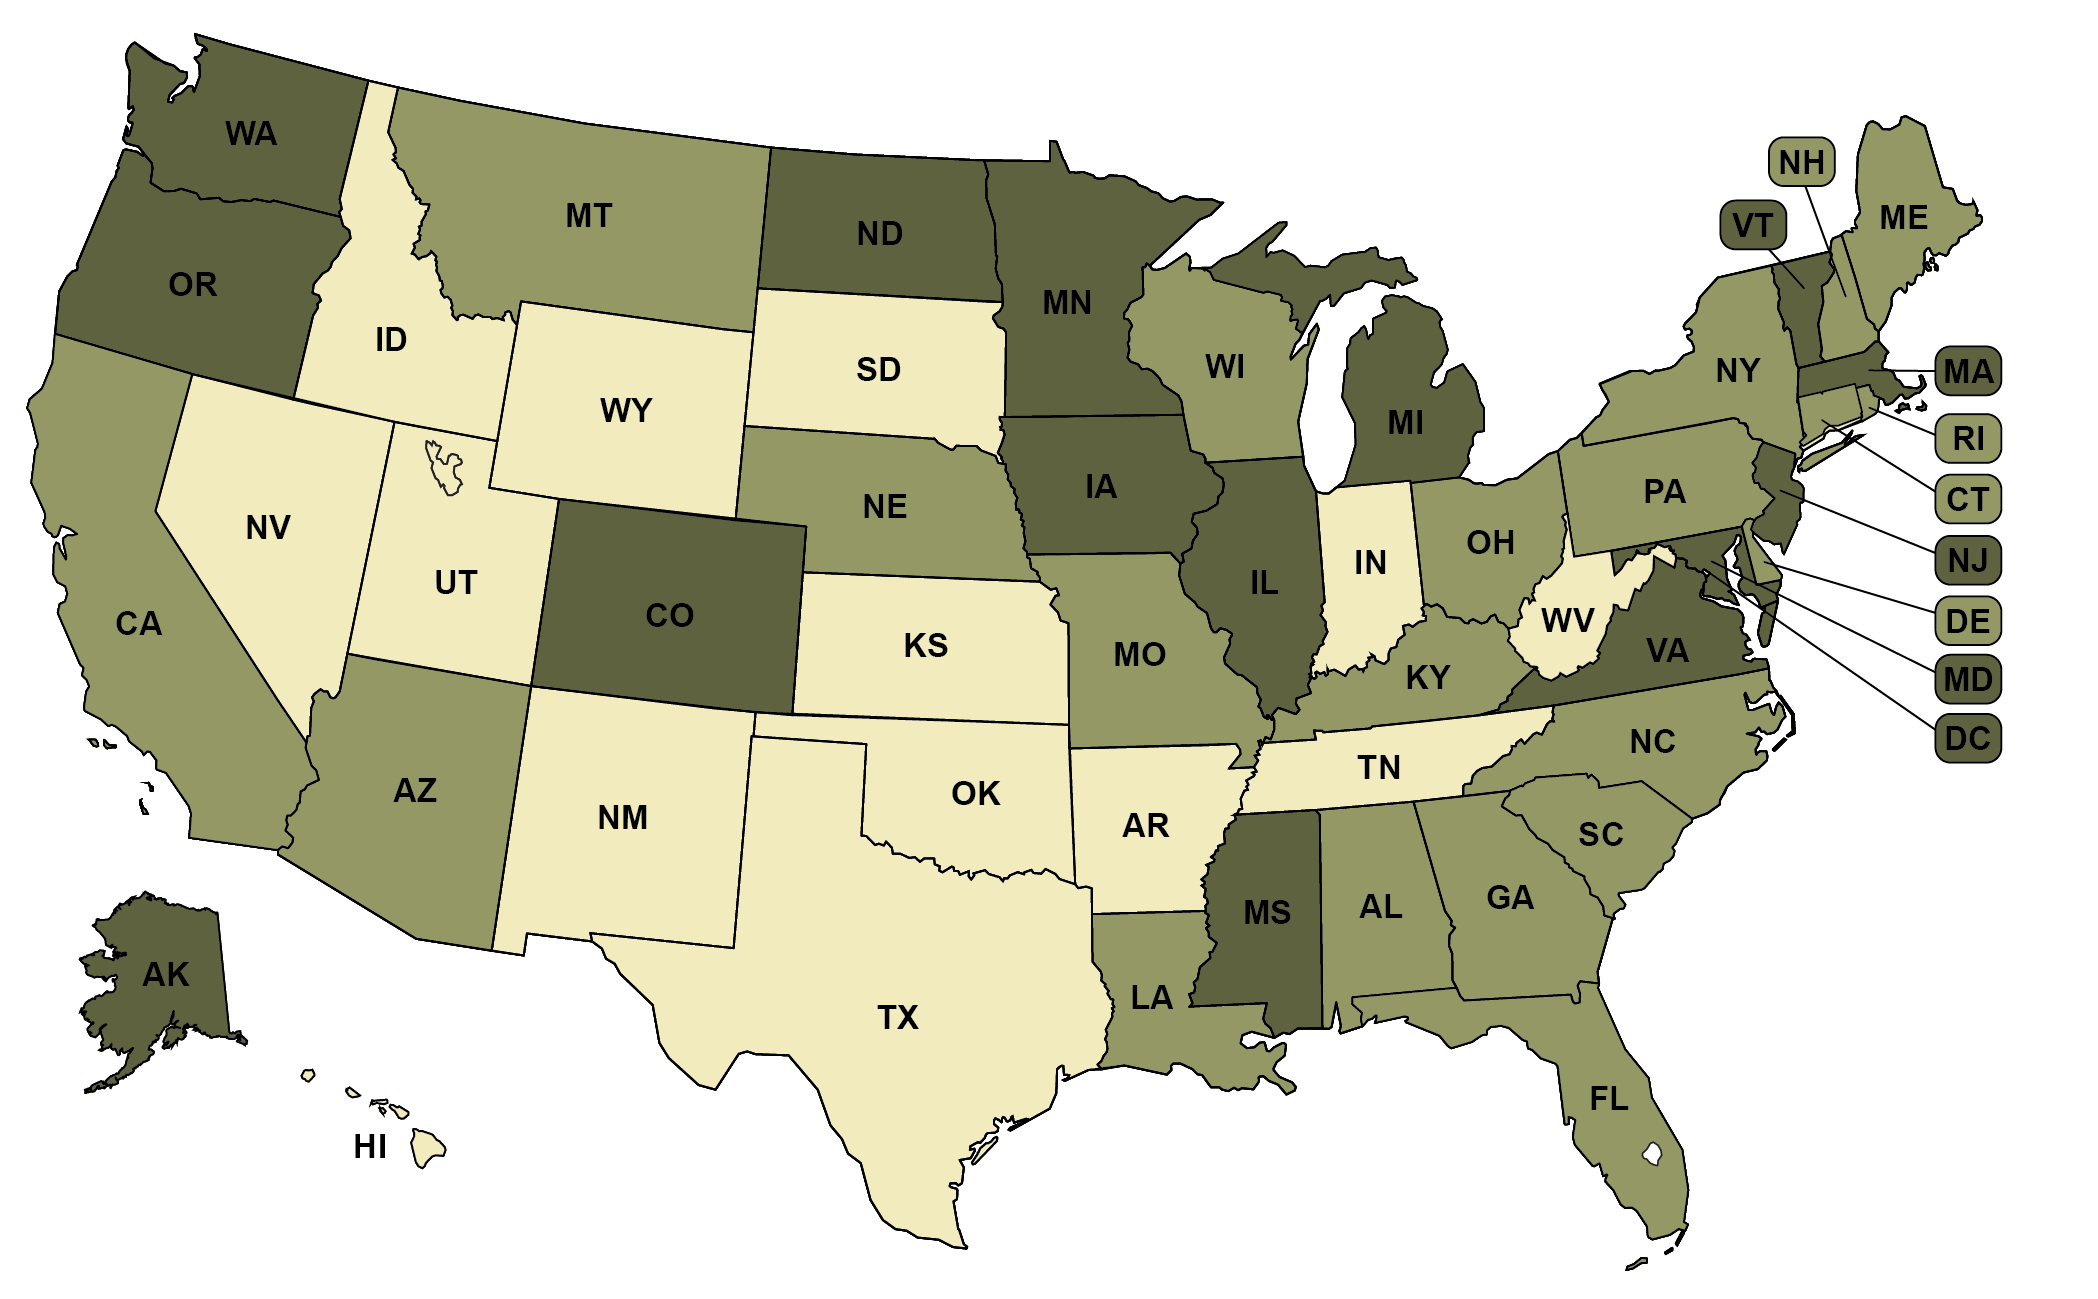
Voter registration rate in 2020 above 89%
(16 states + D.C.)
-
Voter registration rate in 2020 above 85%
(20 states)
-
Voter registration rate in 2020 below 85%
(14 states)
*Note: North Dakota does not require voter registration.
Recommended citation: Movement Advancement Project. "Voter Registration Rates" https://www.mapresearch.org/democracy-maps/voter_registration_rates. Accessed [day of access]
Breakdown by Population
*Note: These percentages reflect the voting-eligible population, as reported by the United States Election Project.
27 % of population lives in states where voter registration rate in 2020 was above 89%
53 % of population lives in states where voter registration rate in 2020 was above 85%
20 % of population lives in states where voter registration rate in 2020 was below 85%