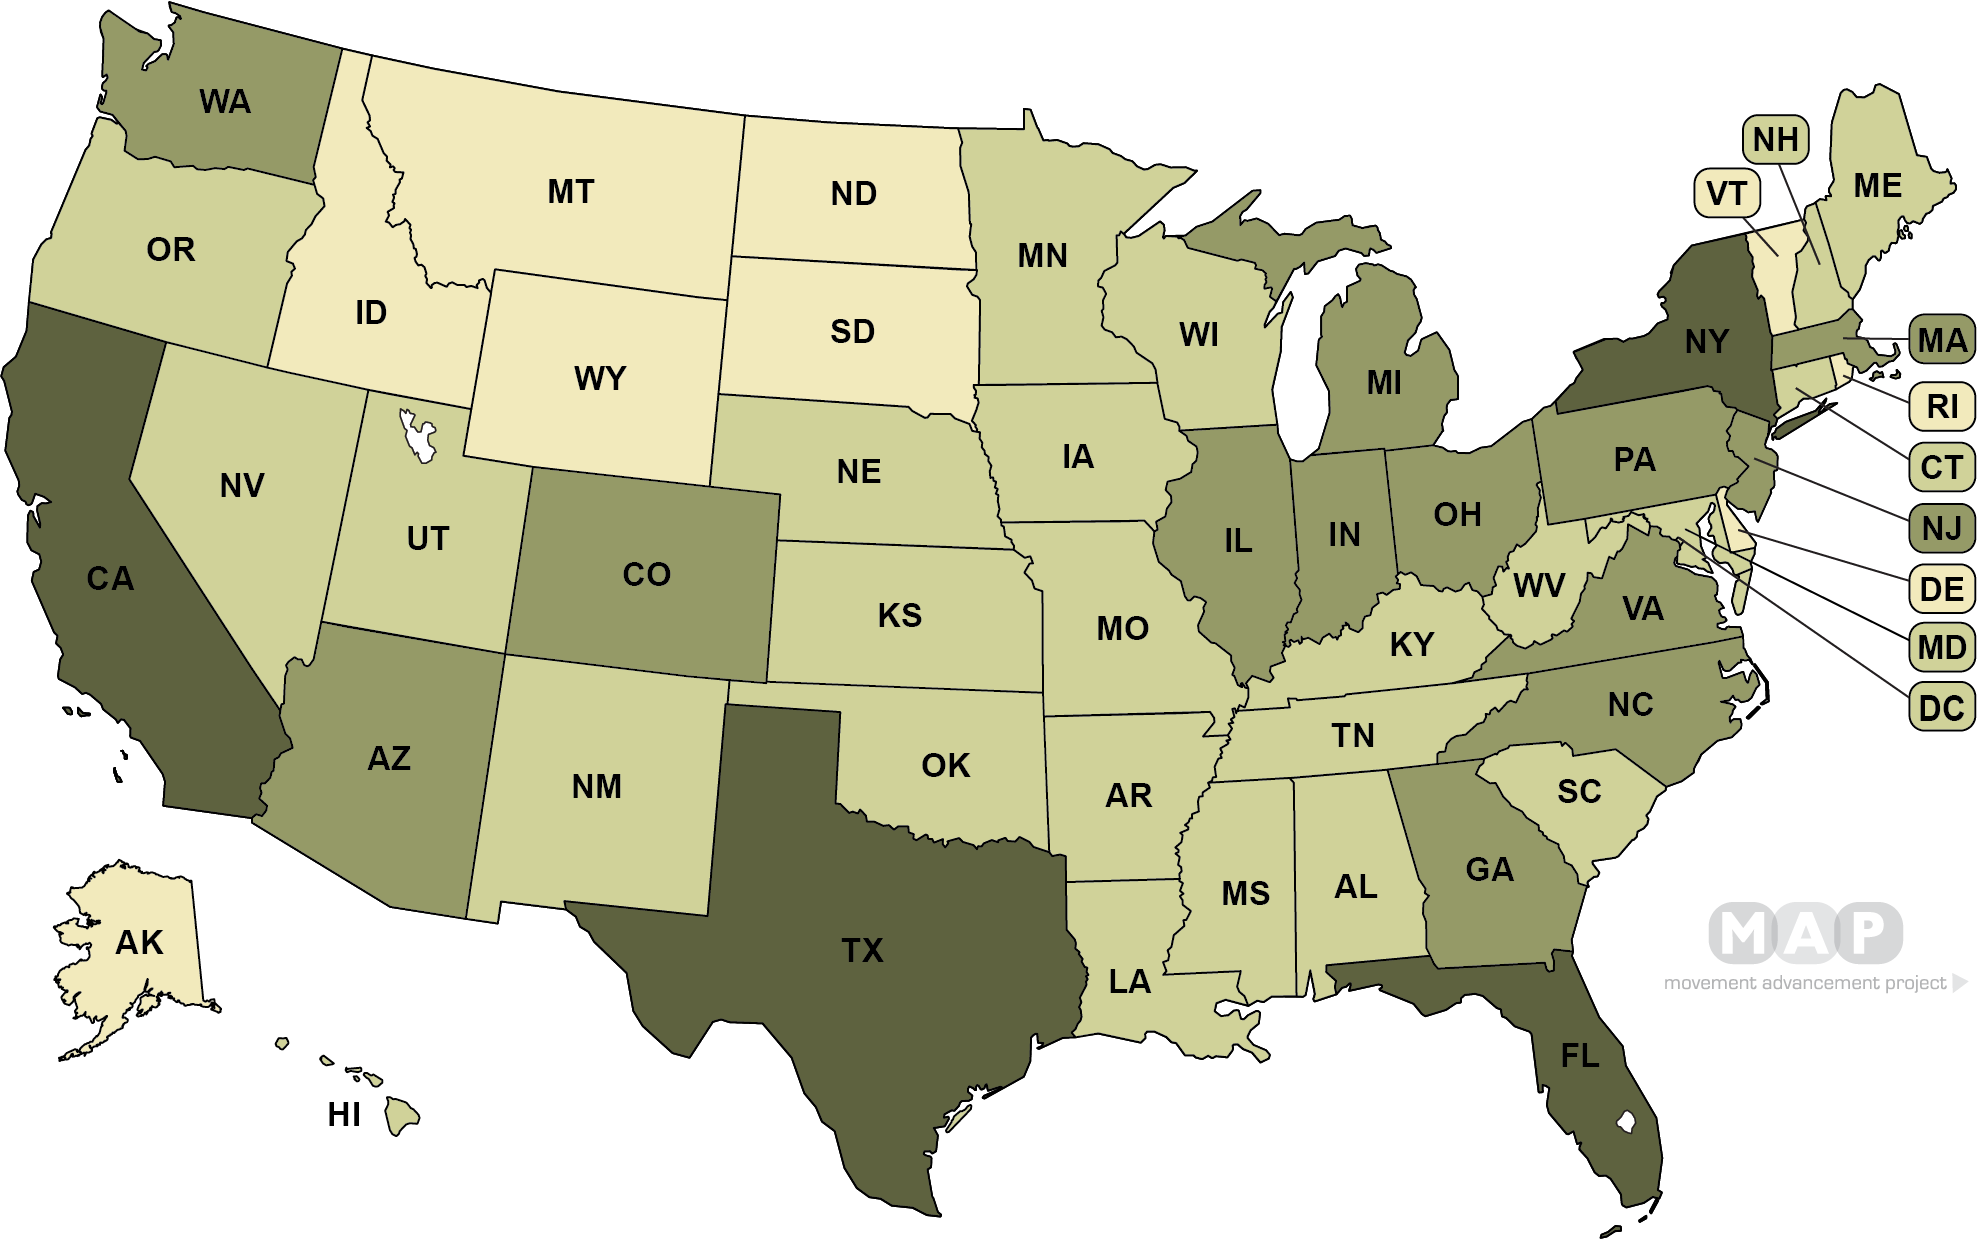
- 500K - 1.4M+
- 200K - 499K
- 50K - 199K
- 8K - 49K
Percent of Adult LGBTQ Population Covered by Laws
*Note: These percentages reflect estimates of the LGBTQ adult population living in the 50 states and the District of Columbia. Estimates of the LGBTQ adult population in the five inhabited U.S. territories are not available, and so cannot be reflected here.

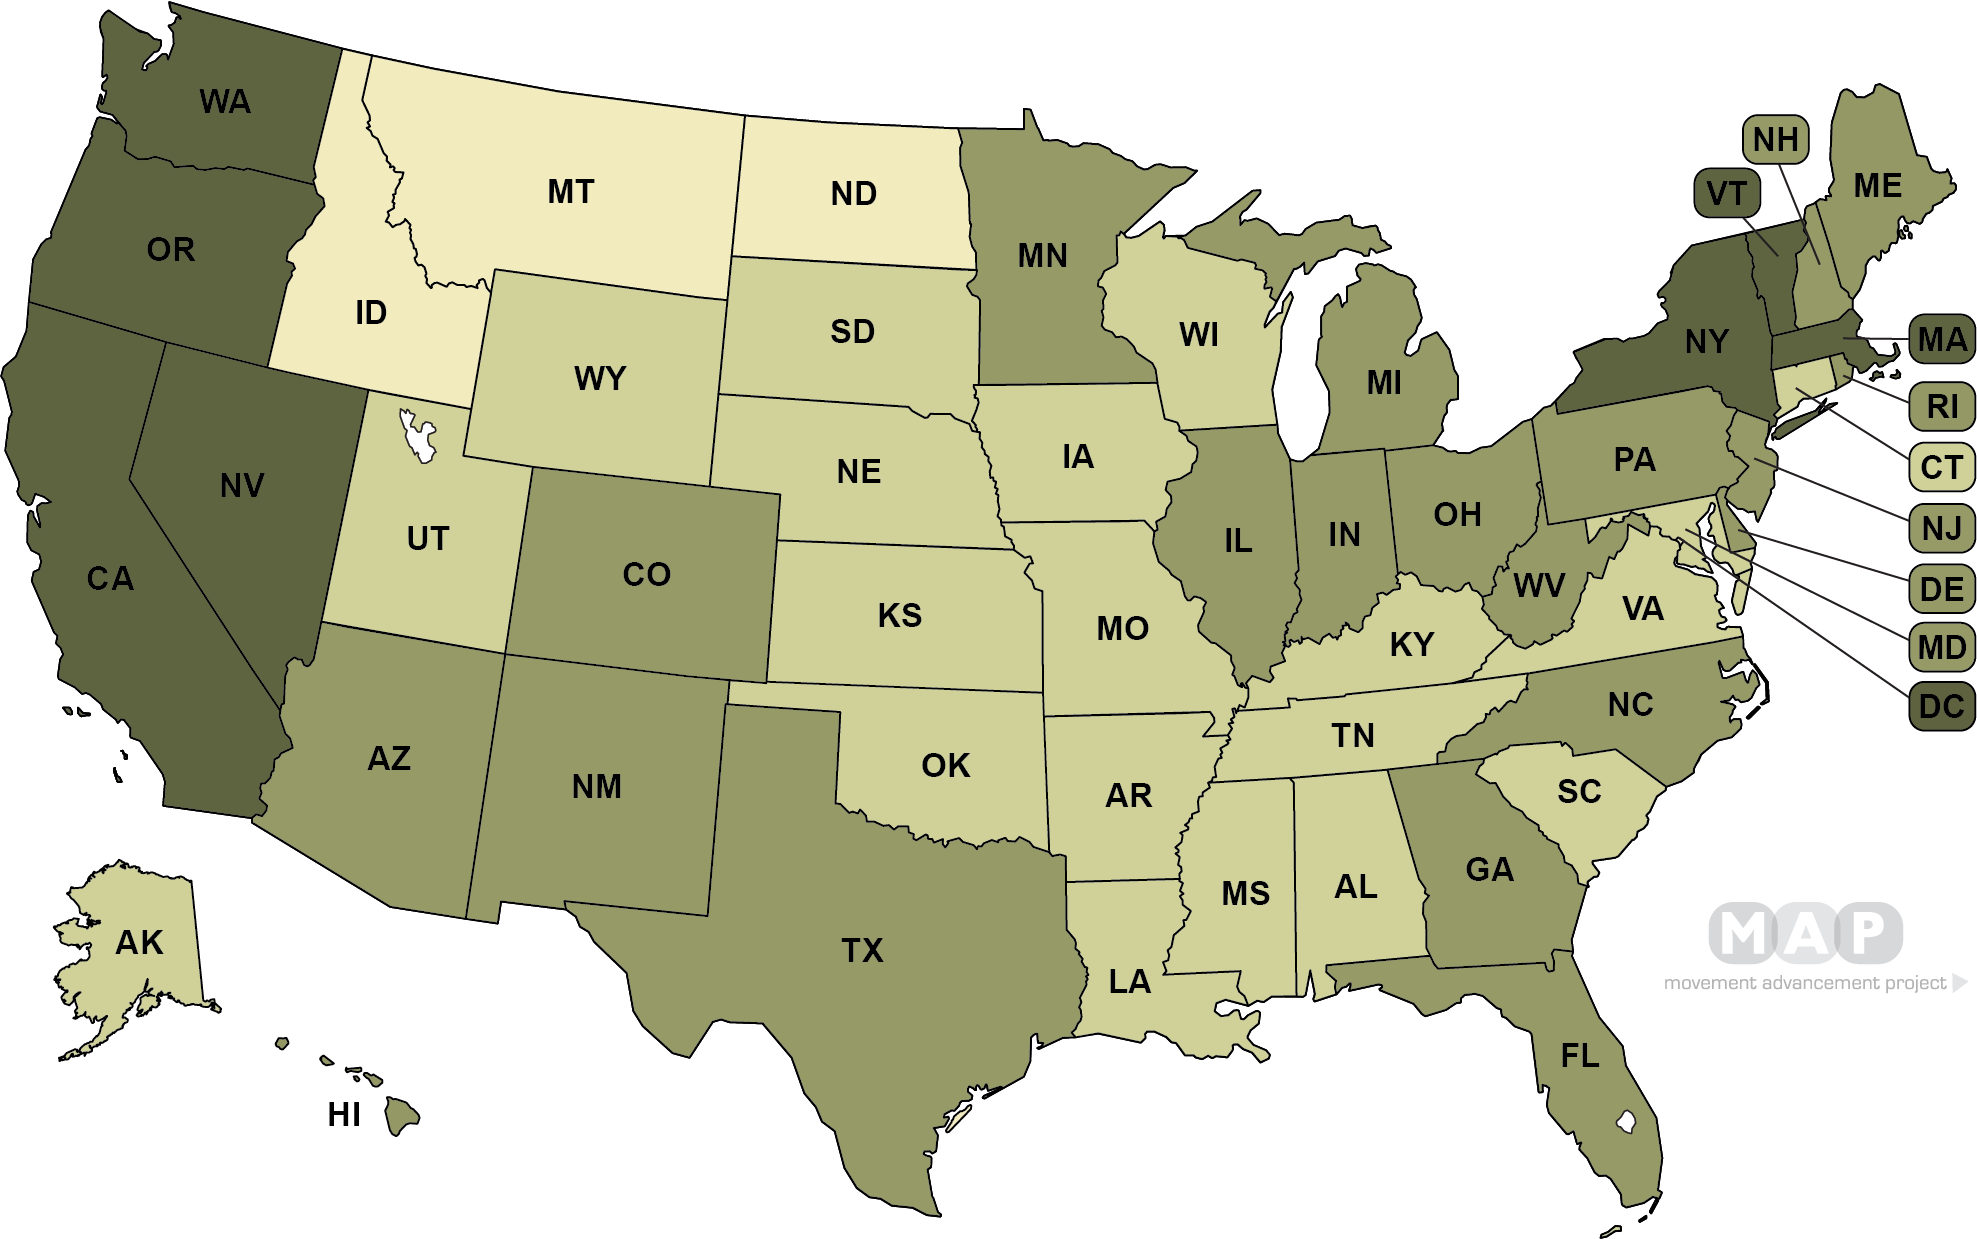
- 5.0% and greater
- 4.0%-4.9%
- 3.0%-3.9%
- 1.5%-2.9%
Percent of Adult LGBTQ Population Covered by Laws
*Note: These percentages reflect estimates of the LGBTQ adult population living in the 50 states and the District of Columbia. Estimates of the LGBTQ adult population in the five inhabited U.S. territories are not available, and so cannot be reflected here.

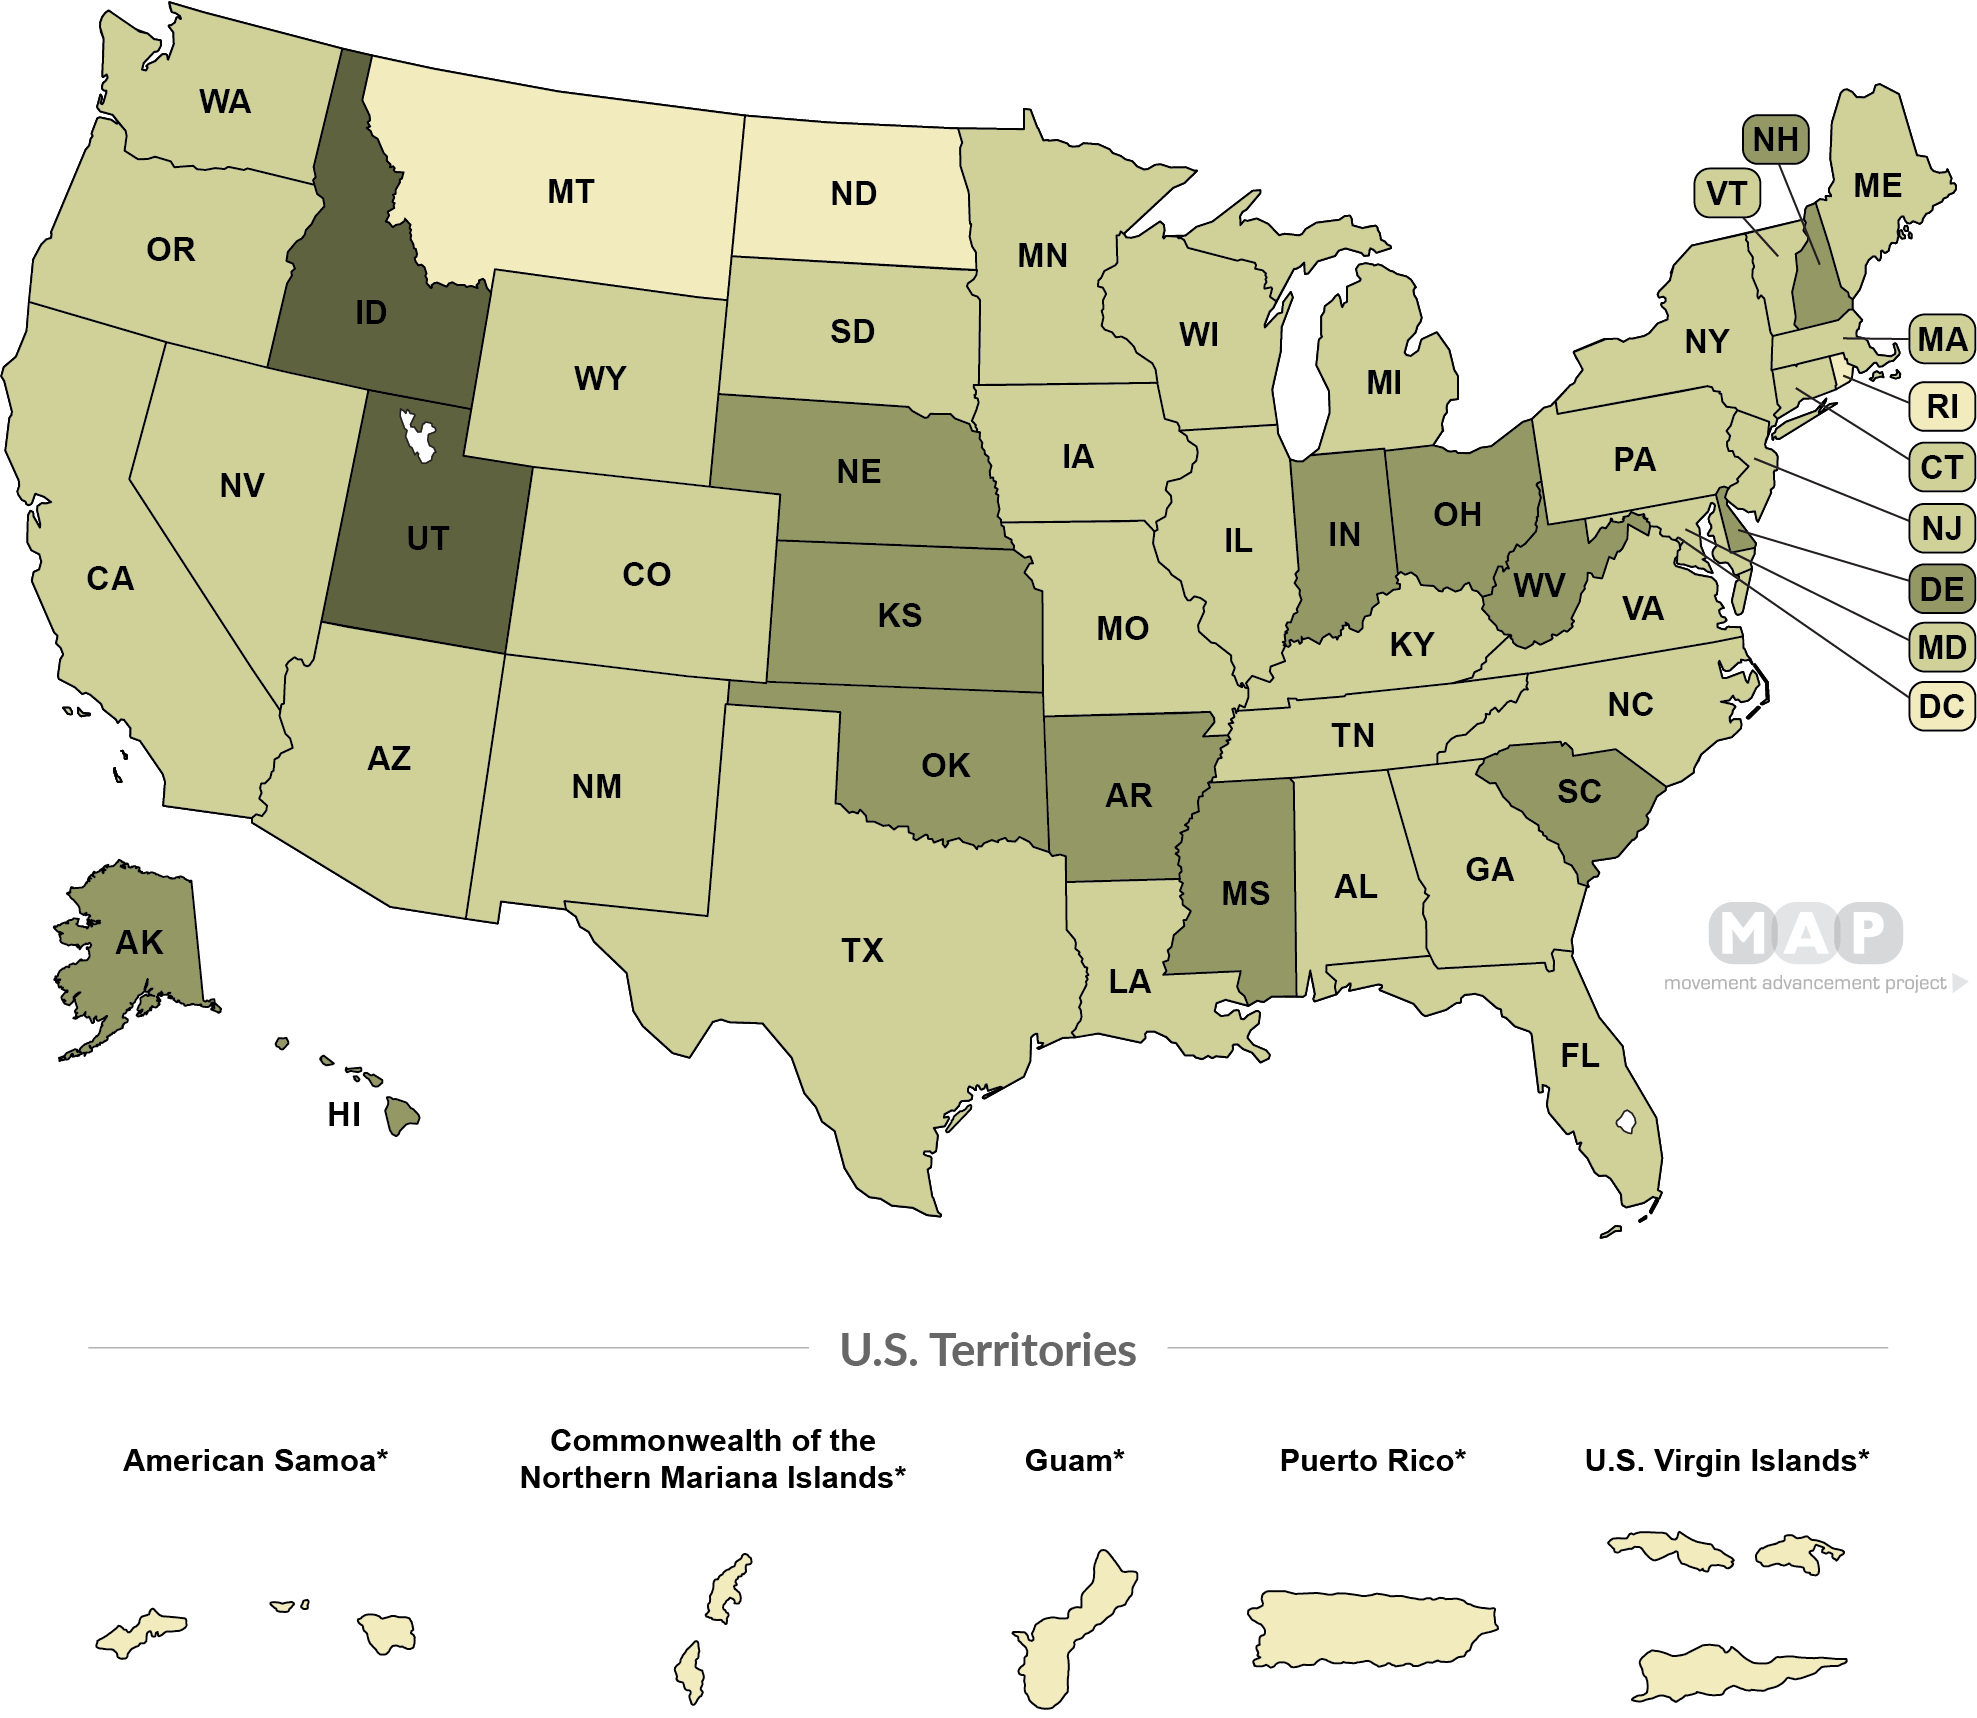
- 40%+ LGBTQ Individuals raising children(2 states)
- 30 - 39.9% LGBTQ individuals raising children (13 states)
- 20 - 29.9% LGBTQ individuals raising children (32 states)
- Under 15% LGBTQ population raising children (3 states , 5 territories + D.C.)
Percent of Adult LGBTQ Population Covered by Laws
*Note: These percentages reflect estimates of the LGBTQ adult population living in the 50 states and the District of Columbia. Estimates of the LGBTQ adult population in the five inhabited U.S. territories are not available, and so cannot be reflected here.

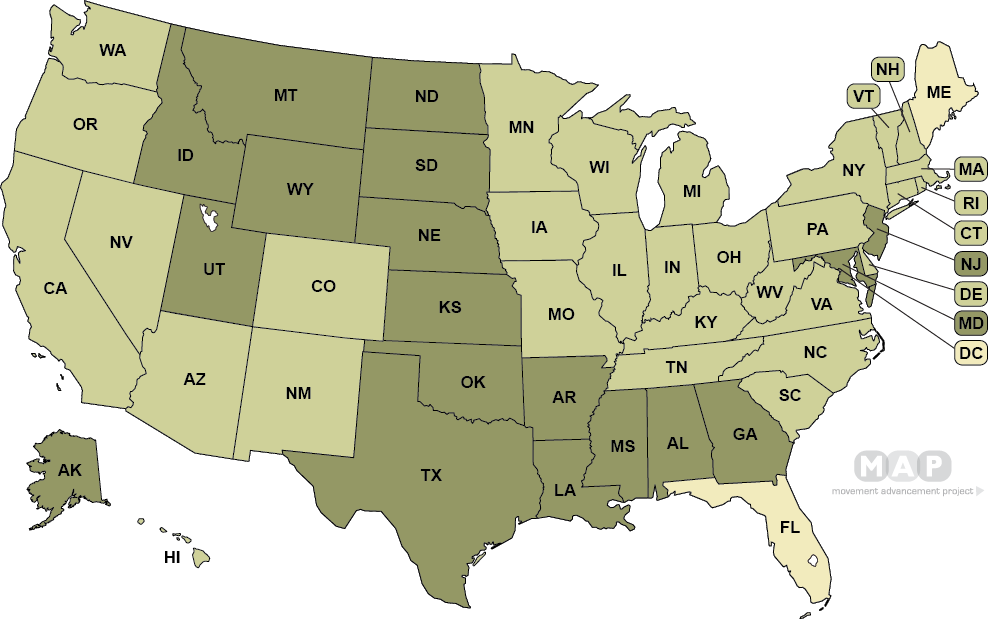
- 20%+ population same-sex couples raising children(13 states)
- 15% - 19.9% population same-sex couples raising children (35 states)
- Under 15% population same-sex couples raising children (2 states , 5 territories + D.C.)
Percent of Adult LGBTQ Population Covered by Laws
*Note: These percentages reflect estimates of the LGBTQ adult population living in the 50 states and the District of Columbia. Estimates of the LGBTQ adult population in the five inhabited U.S. territories are not available, and so cannot be reflected here.
| State | Total Adult Population | LGBT Adult Population | LGBT Population Density | % of LGBTQ Individuals Raising Children | % of Same-Sex Couples Raising Children |
| Alabama | 4,887,871 | 147,000 | 3.1% | 24.0% | 20.4% |
| Alaska | 737,438 | 25,000 | 3.7% | 34.0% | 23.1% |
| American Samoa | 55,519 | N/A | N/A | N/A | N/A |
| Arizona | 7,171,646 | 286,000 | 4.5% | 25.0% | 16.5% |
| Arkansas | 3,013,825 | 95,000 | 3.3% | 36.0% | 21.2% |
| California | 39,557,045 | 1,859,000 | 5.3% | 24.0% | 16.0% |
| Colorado | 5,695,564 | 234,000 | 4.6% | 25.0% | 15.9% |
| Connecticut | 3,572,665 | 133,000 | 3.9% | 20.0% | 17.0% |
| Delaware | 967,171 | 40,000 | 4.5% | 35.0% | 15.6% |
| District of Columbia | 702,455 | 58,000 | 9.8% | 9.0% | 8.7% |
| Florida | 21,299,325 | 886,000 | 4.6% | 24.0% | 13.3% |
| Georgia | 10,519,475 | 425,000 | 4.5% | 27.0% | 19.6% |
| Guam | 159,358 | N/A | N/A | N/A | N/A |
| Hawaii | 1,420,491 | 59,000 | 4.6% | 30.0% | 15.8% |
| Idaho | 1,754,208 | 48,000 | 2.8% | 44.0% | 22.3% |
| Illinois | 12,741,080 | 506,000 | 4.3% | 28.0% | 16.6% |
| Indiana | 6,691,878 | 272,000 | 4.5% | 34.0% | 18.9% |
| Iowa | 3,156,145 | 106,000 | 3.6% | 27.0% | 18.6% |
| Kansas | 2,911,505 | 92,000 | 3.3% | 33.0% | 21.8% |
| Kentucky | 4,468,402 | 144,000 | 3.4% | 26.0% | 18.5% |
| Louisiana | 4,659,978 | 169,000 | 3.9% | 28.0% | 19.9% |
| Maine | 1,338,404 | 60,000 | 4.9% | 21.0% | 13.8% |
| Maryland | 6,042,718 | 234,000 | 4.2% | 20.0% | 20.3% |
| Massachusetts | 6,902,149 | 335,000 | 5.4% | 21.0% | 17.1% |
| Michigan | 9,995,915 | 373,000 | 4.0% | 27.0% | 18.2% |
| Minnesota | 5,611,179 | 210,000 | 4.1% | 28.0% | 16.5% |
| Mississippi | 2,986,530 | 99,000 | 3.5% | 34.0% | 25.7% |
| Missouri | 6,126,452 | 217,000 | 3.8% | 26.0% | 17.3% |
| Montana | 1,062,305 | 30,000 | 2.9% | 19.0% | 22.0% |
| Nebraska | 1,929,268 | 67,000 | 3.8% | 32.0% | 19.6% |
| Nevada | 3,034,392 | 145,000 | 5.5% | 22.0% | 17.0% |
| New Hampshire | 1,356,458 | 59,000 | 4.7% | 31.0% | 16.5% |
| New Jersey | 8,908,520 | 343,000 | 4.1% | 25.0% | 19.7% |
| New Mexico | 2,095,428 | 85,000 | 4.5% | 29.0% | 17.8% |
| New York | 19,542,209 | 913,000 | 5.1% | 22.0% | 16.4% |
| North Carolina | 10,383,620 | 382,000 | 4.0% | 26.0% | 18.5% |
| North Dakota | 760,077 | 20,000 | 2.7% | 10.0% | 21.6% |
| Northern Mariana Islands | 53,833 | N/A | N/A | N/A | N/A |
| Ohio | 11,689,442 | 462,000 | 4.3% | 30.0% | 17.7% |
| Oklahoma | 3,943,079 | 138,000 | 3.8% | 38.0% | 20.9% |
| Oregon | 4,190,713 | 207,000 | 5.6% | 23.0% | 16.3% |
| Pennsylvania | 12,807,060 | 490,000 | 4.1% | 27.0% | 15.9% |
| Puerto Rico | 3,195,153 | N/A | N/A | N/A | N/A |
| Rhode Island | 1,057,315 | 44,000 | 4.5% | 19.0% | 15.5% |
| South Carolina | 5,084,127 | 167,000 | 3.5% | 30.0% | 18.9% |
| South Dakota | 882,235 | 25,000 | 3.0% | 29.0% | 21.1% |
| Tennessee | 6,770,010 | 223,000 | 3.5% | 29.0% | 18.1% |
| Texas | 28,701,845 | 1,053,000 | 4.1% | 29.0% | 19.8% |
| U.S. Virgin Islands | 106,405 | N/A | N/A | N/A | N/A |
| Utah | 3,161,108 | 104,000 | 3.7% | 40.0% | 20.1% |
| Vermont | 626,299 | 30,000 | 5.2% | 23.0% | 18.6% |
| Virginia | 8,517,685 | 308,000 | 3.9% | 26.0% | 16.0% |
| Washington | 7,535,591 | 342,000 | 5.2% | 28.0% | 15.8% |
| West Virginia | 1,805,832 | 68,000 | 4.0% | 31.0% | 17.8% |
| Wisconsin | 5,813,568 | 207,000 | 3.8% | 29.0% | 16.4% |
| Wyoming | 577,737 | 18,000 | 3.3% | 28.0% | 24.7% |
