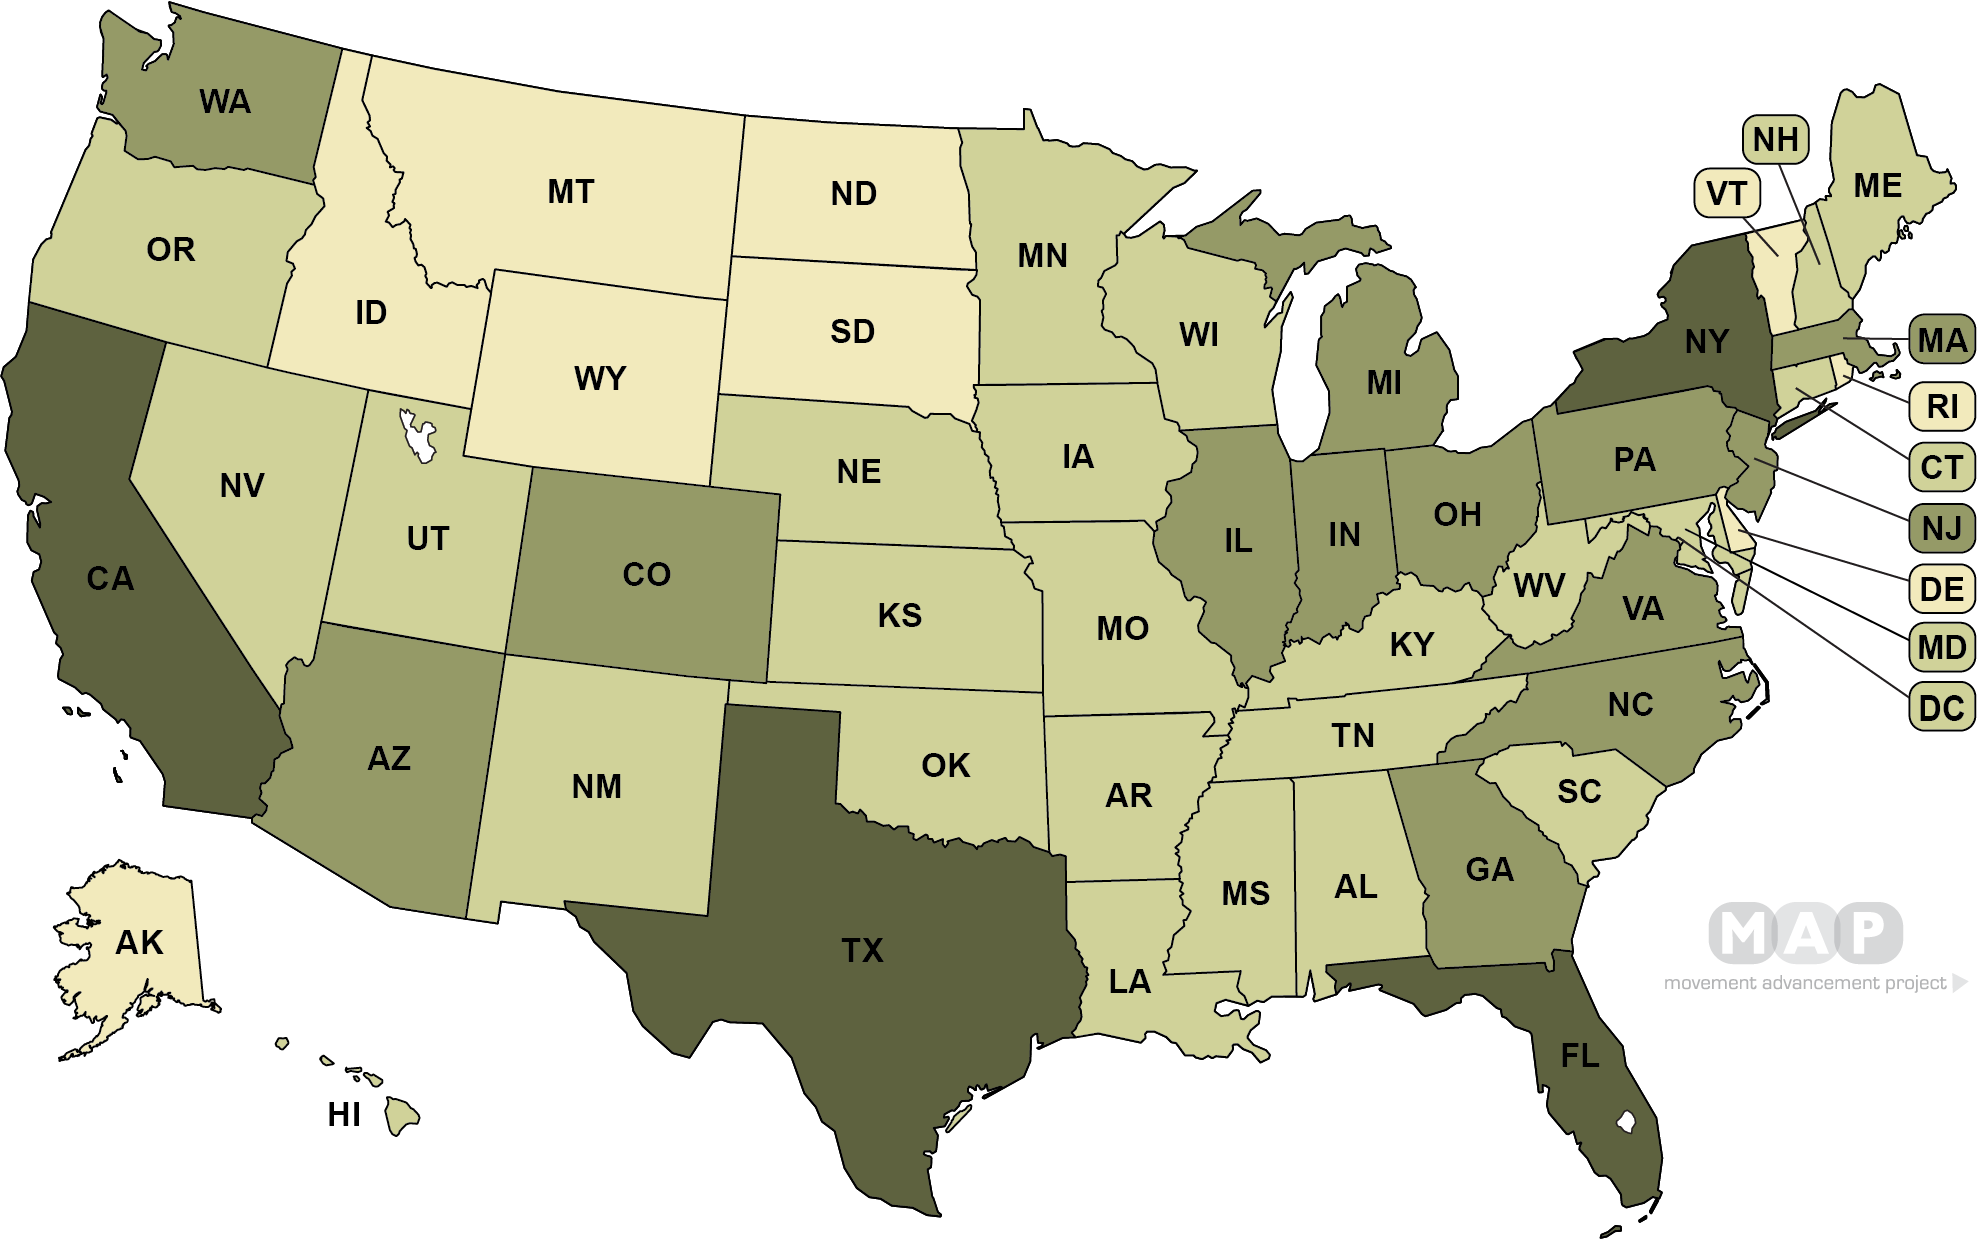
This map shows the estimated raw number of LGBT people (ages 13+) living in each state. The data are based on a Williams Institute analysis of surveys conducted by Gallup Polling (2012-2017) and the Centers for Disease Control and Prevention (CDC; 2015 and 2017 YRBS). For more information, see the methodology in the Williams analysis.
500K - 1.4M+
200K - 499K
50K - 199K
8K - 49K
Data are not currently available about LGBT people living in the U.S. territories.
Percent of Adult LGBTQ Population Covered by Laws
*Note: These percentages reflect estimates of the LGBTQ adult population living in the 50 states and the District of Columbia. Estimates of the LGBTQ adult population in the five inhabited U.S. territories are not available, and so cannot be reflected here.
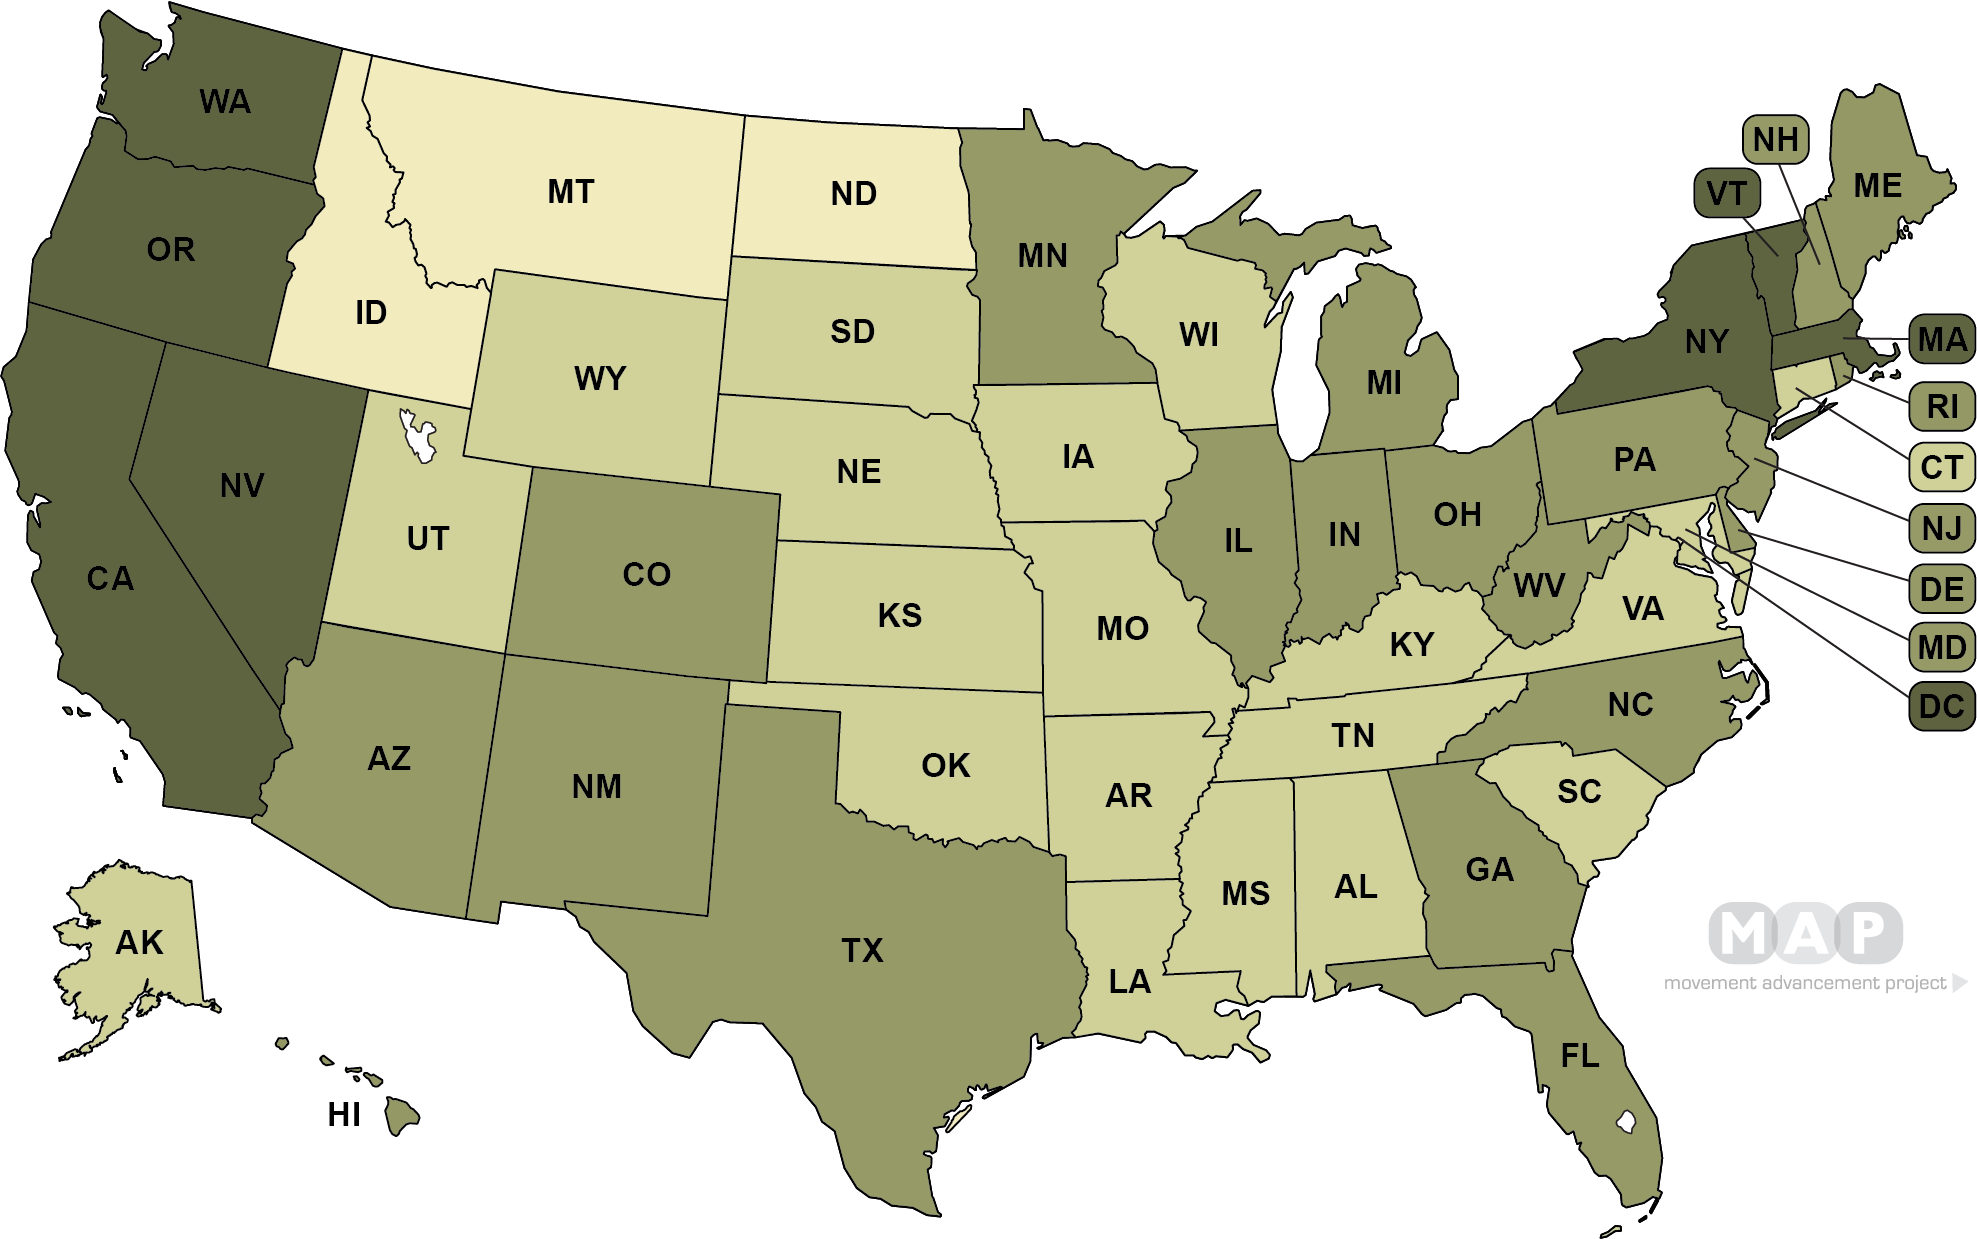
This map shows the estimated percentage of each state's adult (ages 18+) population that identifies as lesbian, gay, bisexual, or transgender, based on a 2018 analysis of Gallup data by The Williams Institute.
5.0% and greater
4.0%-4.9%
3.0%-3.9%
1.5%-2.9%
Percent of Adult LGBTQ Population Covered by Laws
*Note: These percentages reflect estimates of the LGBTQ adult population living in the 50 states and the District of Columbia. Estimates of the LGBTQ adult population in the five inhabited U.S. territories are not available, and so cannot be reflected here.
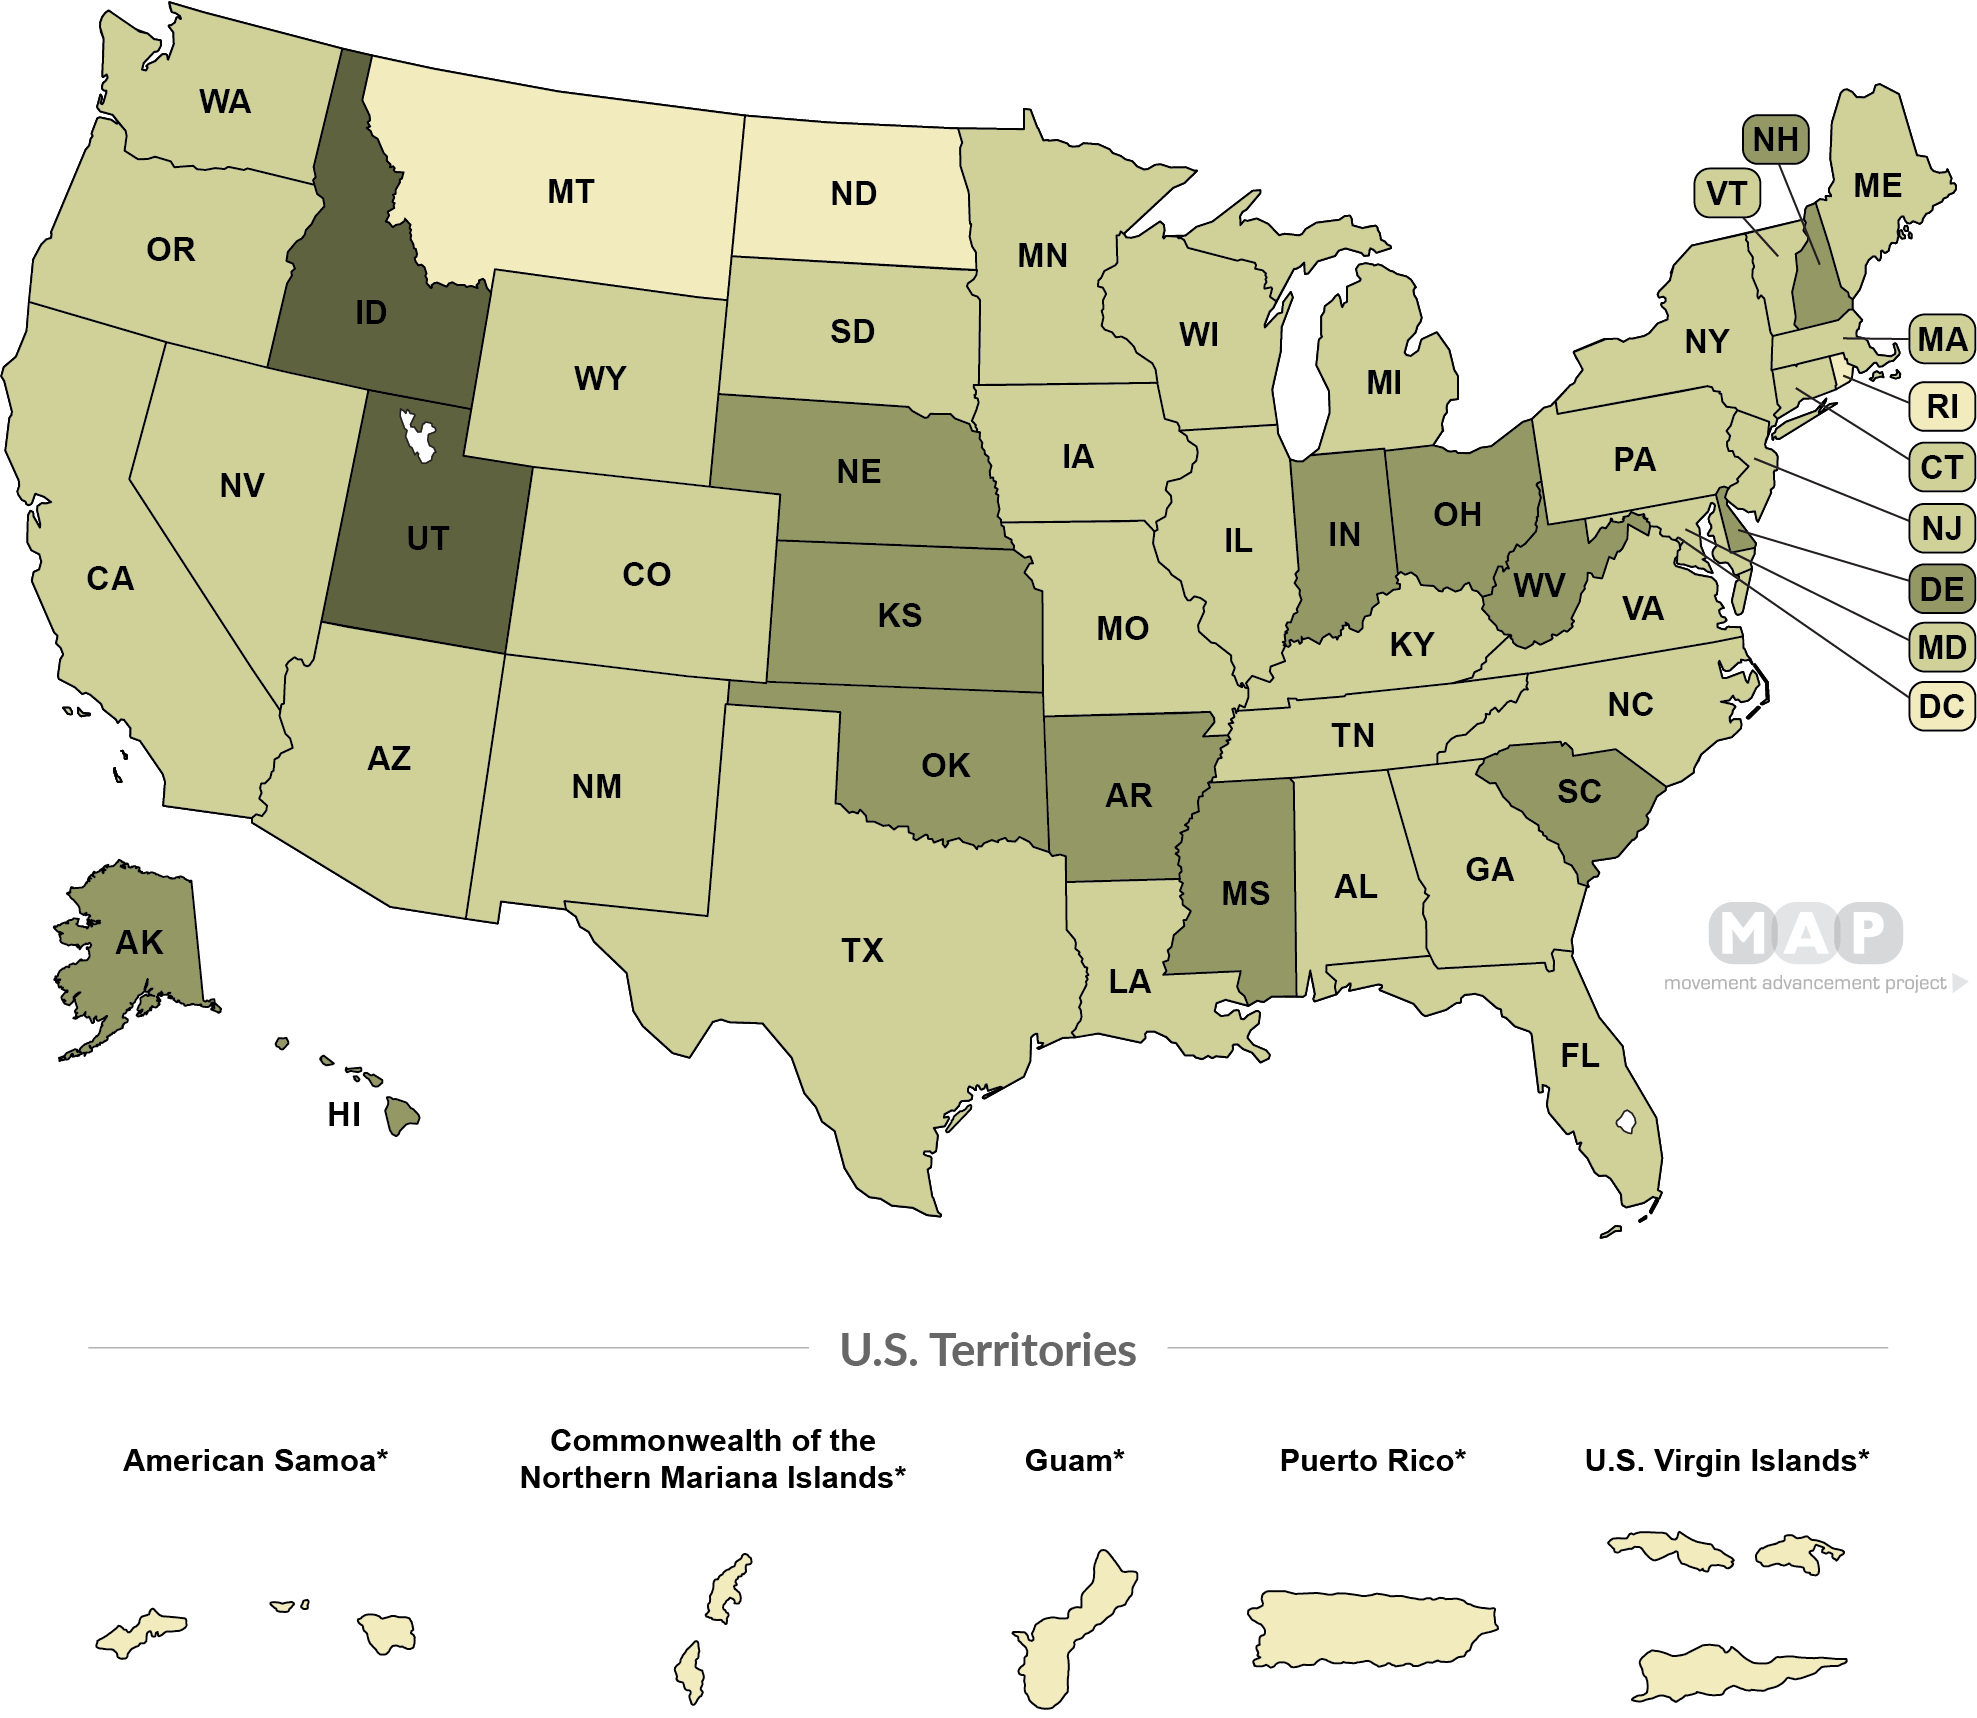
This map shows the percent of LGBT people (ages 25 and over) raising children in each state, based on data collected by Gallup and analyzed by the The Williams Institute. Data for the five U.S. territories are not available. For more information, contact The Williams Institute.
40%+ LGBTQ Individuals raising children(2 states)
30 - 39.9% LGBTQ individuals raising children (13 states)
20 - 29.9% LGBTQ individuals raising children (32 states)
Under 15% LGBTQ population raising children (3 states , 5 territories + D.C.)
*Data for the five U.S. territories are not available. For more information, contact the Williams Institute.
Percent of Adult LGBTQ Population Covered by Laws
*Note: These percentages reflect estimates of the LGBTQ adult population living in the 50 states and the District of Columbia. Estimates of the LGBTQ adult population in the five inhabited U.S. territories are not available, and so cannot be reflected here.
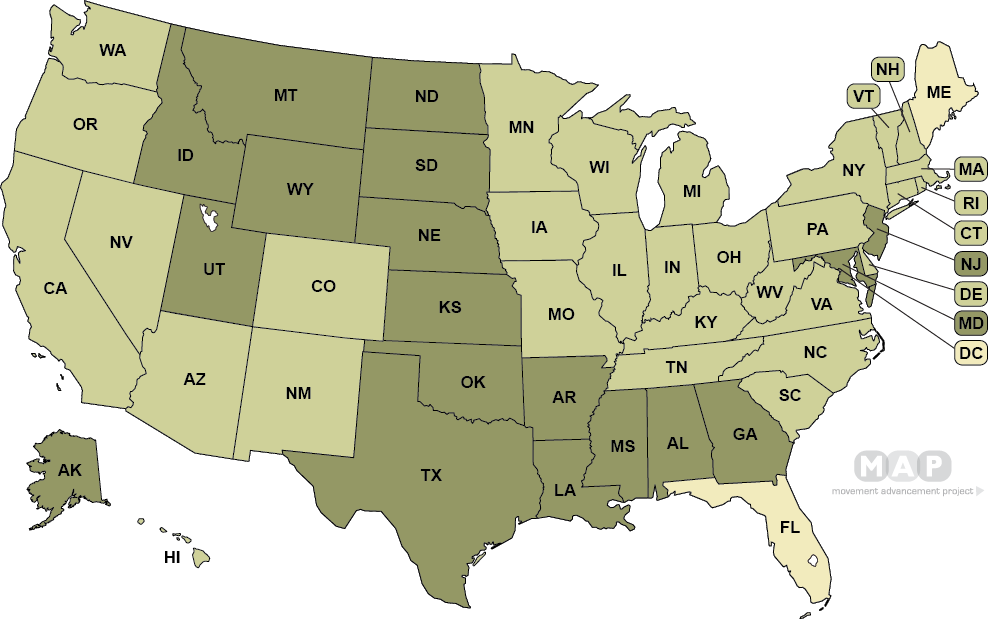
This map shows the percent of same-sex couples raising children in each state, based on data collected by the 2010 U.S. Census and analyzed by the The Williams Institute. For more information, contact The Williams Institute.
20%+ population same-sex couples raising children(13 states)
15% - 19.9% population same-sex couples raising children (35 states)
Under 15% population same-sex couples raising children (2 states , 5 territories + D.C.)
Percent of Adult LGBTQ Population Covered by Laws
*Note: These percentages reflect estimates of the LGBTQ adult population living in the 50 states and the District of Columbia. Estimates of the LGBTQ adult population in the five inhabited U.S. territories are not available, and so cannot be reflected here.